Fig. 2.
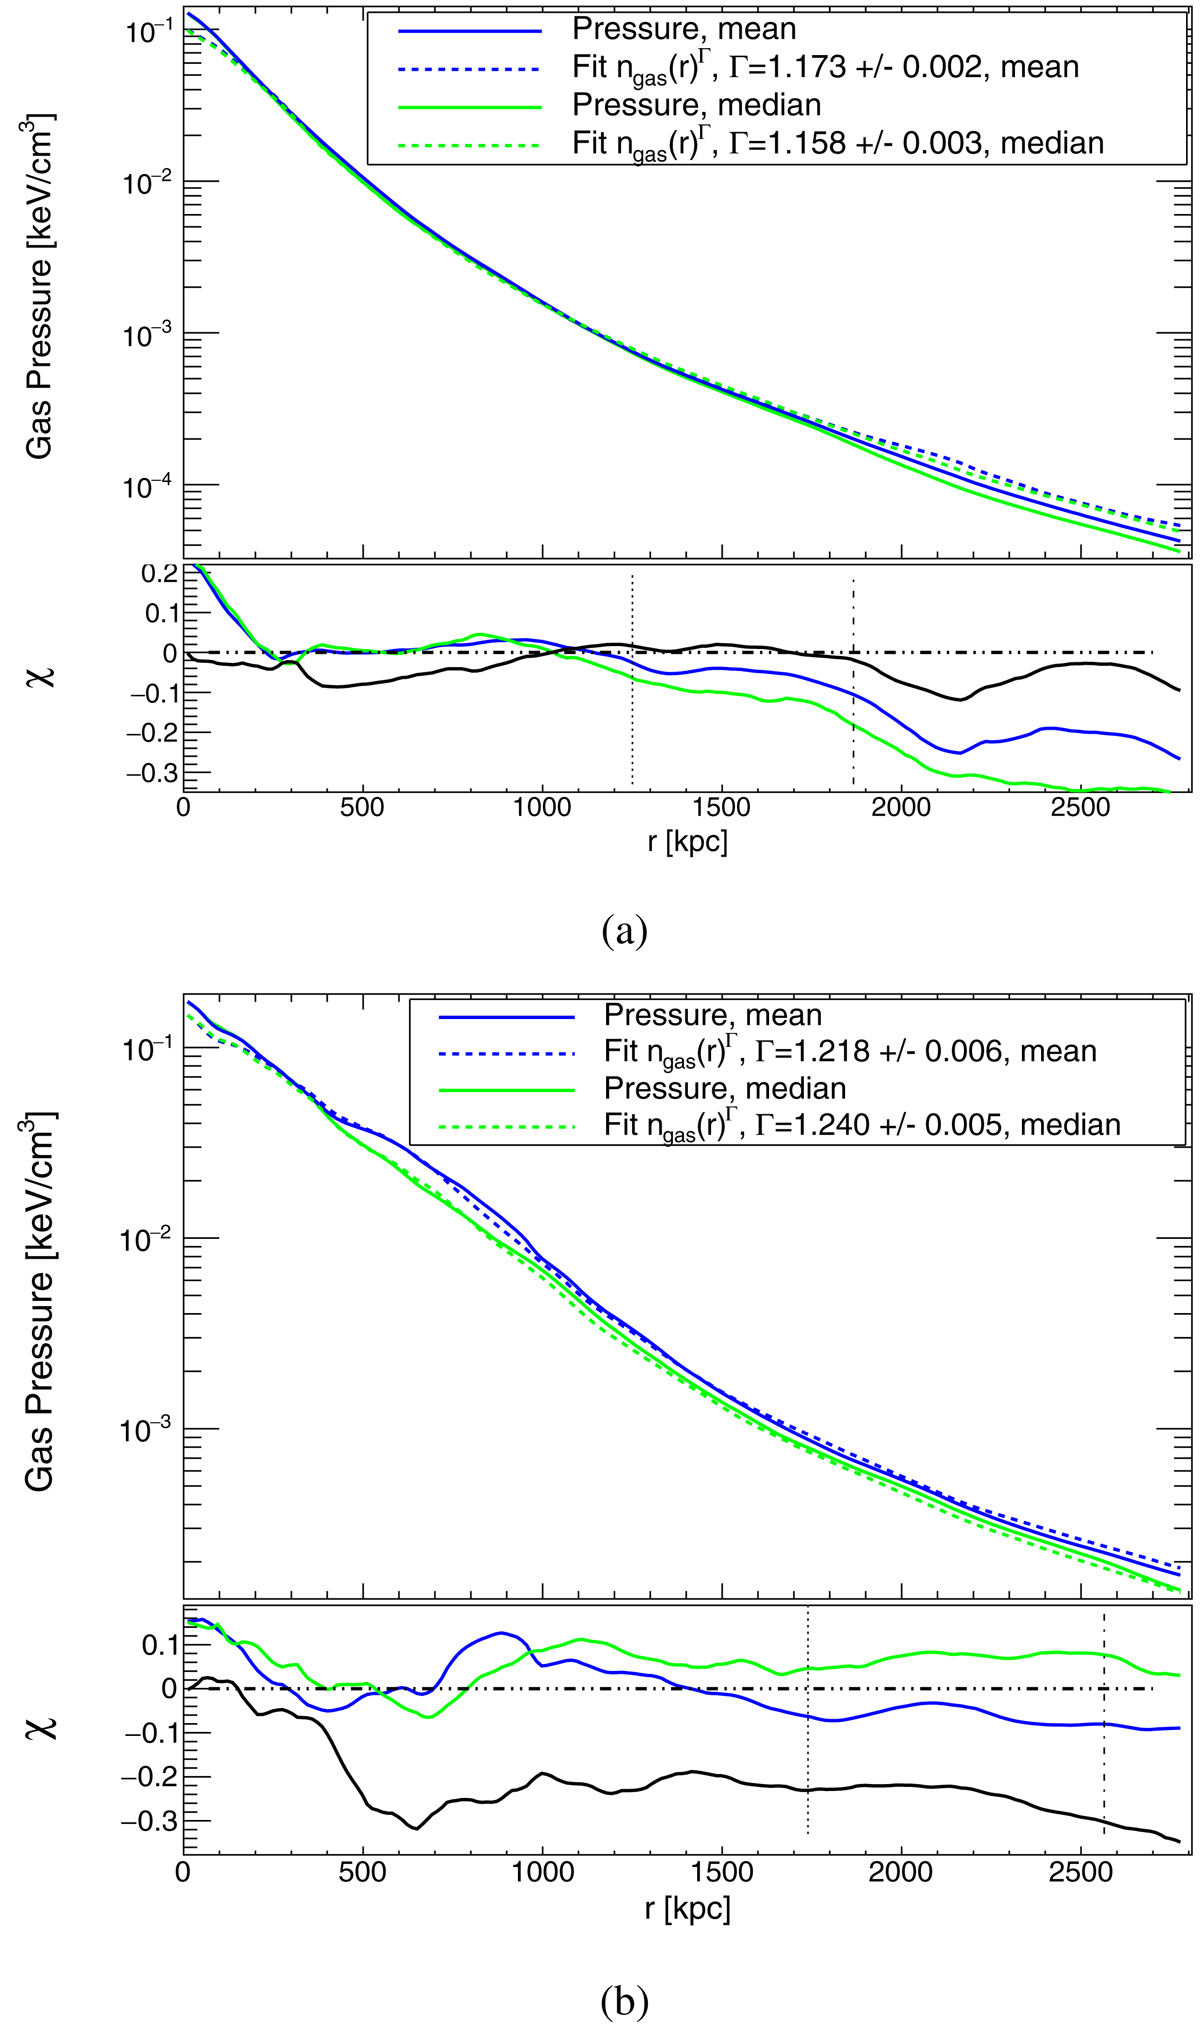
Fit of the polytropic stratification relation on the pressure [kev cm−3] and gas density [cm−3] profiles extracted in spherical shells. Top panel: pressure profile (solid line) and its fitted model (dashed line) are shown in blue, for the mean profiles and in green, for the median profiles. Bottom panel: relative residuals between the pressure profile and its fitted model are shown in blue, for the mean profiles and in green, for the median profiles. The relative residuals between the two models for the pressure profile, computed as ((ngas, median(r))Γmedian − (ngas, mean(r))Γmean)/(ngas, median(r))Γmedian are displayed in black. The vertical lines represent R500 and R200; (a) for CL135: fit performed over radii larger than 200 kpc; (b) for CL77: fit performed over radii larger than 350 kpc for the median profiles and over radii larger than 200 kpc for the mean profiles.
Current usage metrics show cumulative count of Article Views (full-text article views including HTML views, PDF and ePub downloads, according to the available data) and Abstracts Views on Vision4Press platform.
Data correspond to usage on the plateform after 2015. The current usage metrics is available 48-96 hours after online publication and is updated daily on week days.
Initial download of the metrics may take a while.