Fig. 9
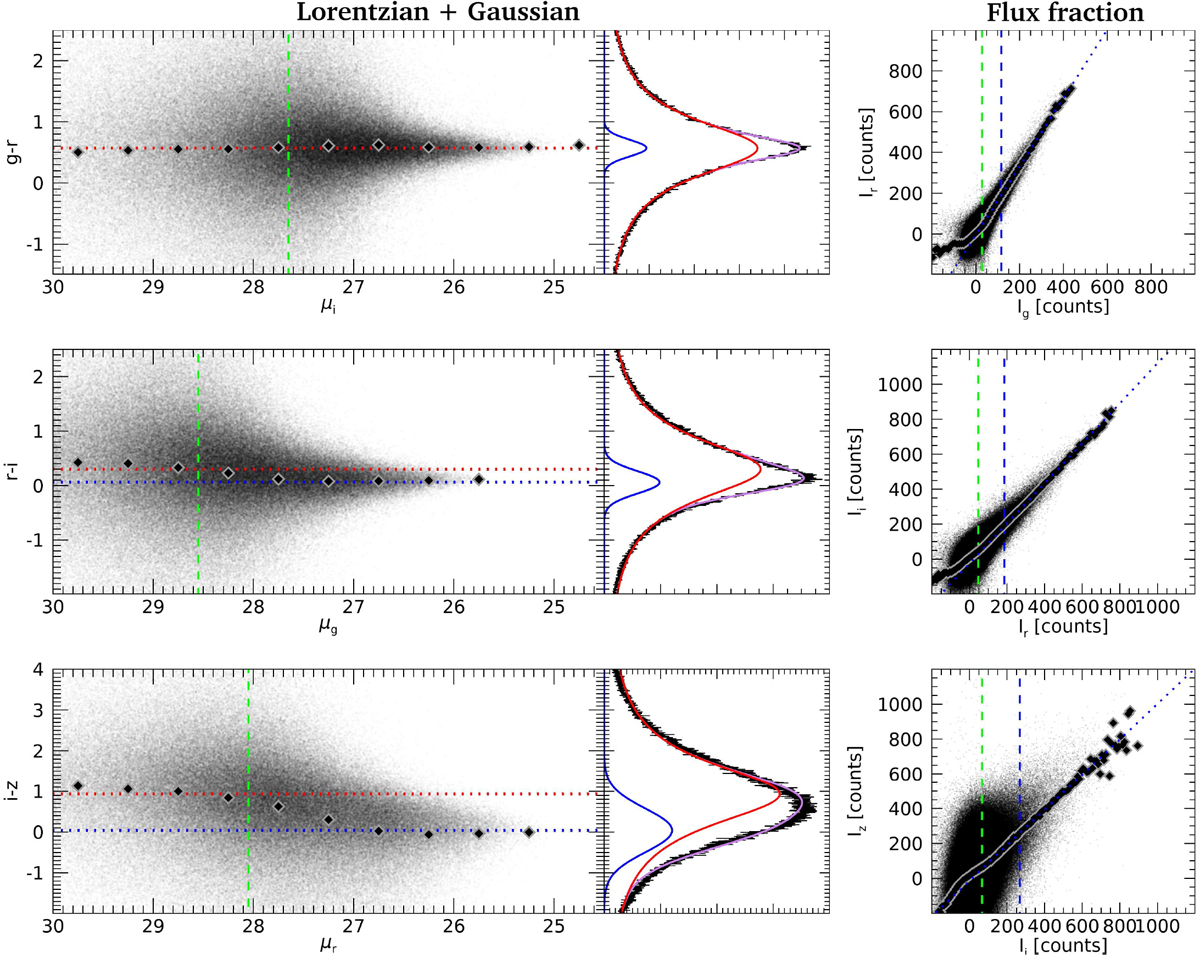
Visual representation of the methodology for obtaining the colors of the Cirrus field. Left panels: color vs. surface brightness distribution of the pixels (6 arcsec width). The black diamonds represent the average color in surface brightness bins of 0.5 mag arcsec−2. The green dashed line marks the 3σ detection limit of the band in the x-axis. The blue and red dotted lines mark the center of the Gaussian and Lorentzian fitted functions respectively (xg and xL). The central panels correspond to the color distribution histograms. The black line shows the observed color distribution. The purple line shows the Gaussian plus Lorentzian fitted function, while the blue and red lines show the Gaussian and Lorentzian functions independently. On the right panels, we illustrate the flux fraction method. The correlation between the fluxes in each optical band is shown. The green dashed line marks the 3σ detection limit of the band in the x-axis. The blue dashed line marks the 3σ detection limit + 1.5 mag arcsec−2 of the band in the x-axis (see text for details). The black diamonds represent the average flux of the band in the y-axis in bins of 10 counts for the band in the x-axis. The dotted line indicates the best linear fit.
Current usage metrics show cumulative count of Article Views (full-text article views including HTML views, PDF and ePub downloads, according to the available data) and Abstracts Views on Vision4Press platform.
Data correspond to usage on the plateform after 2015. The current usage metrics is available 48-96 hours after online publication and is updated daily on week days.
Initial download of the metrics may take a while.