Fig. 6
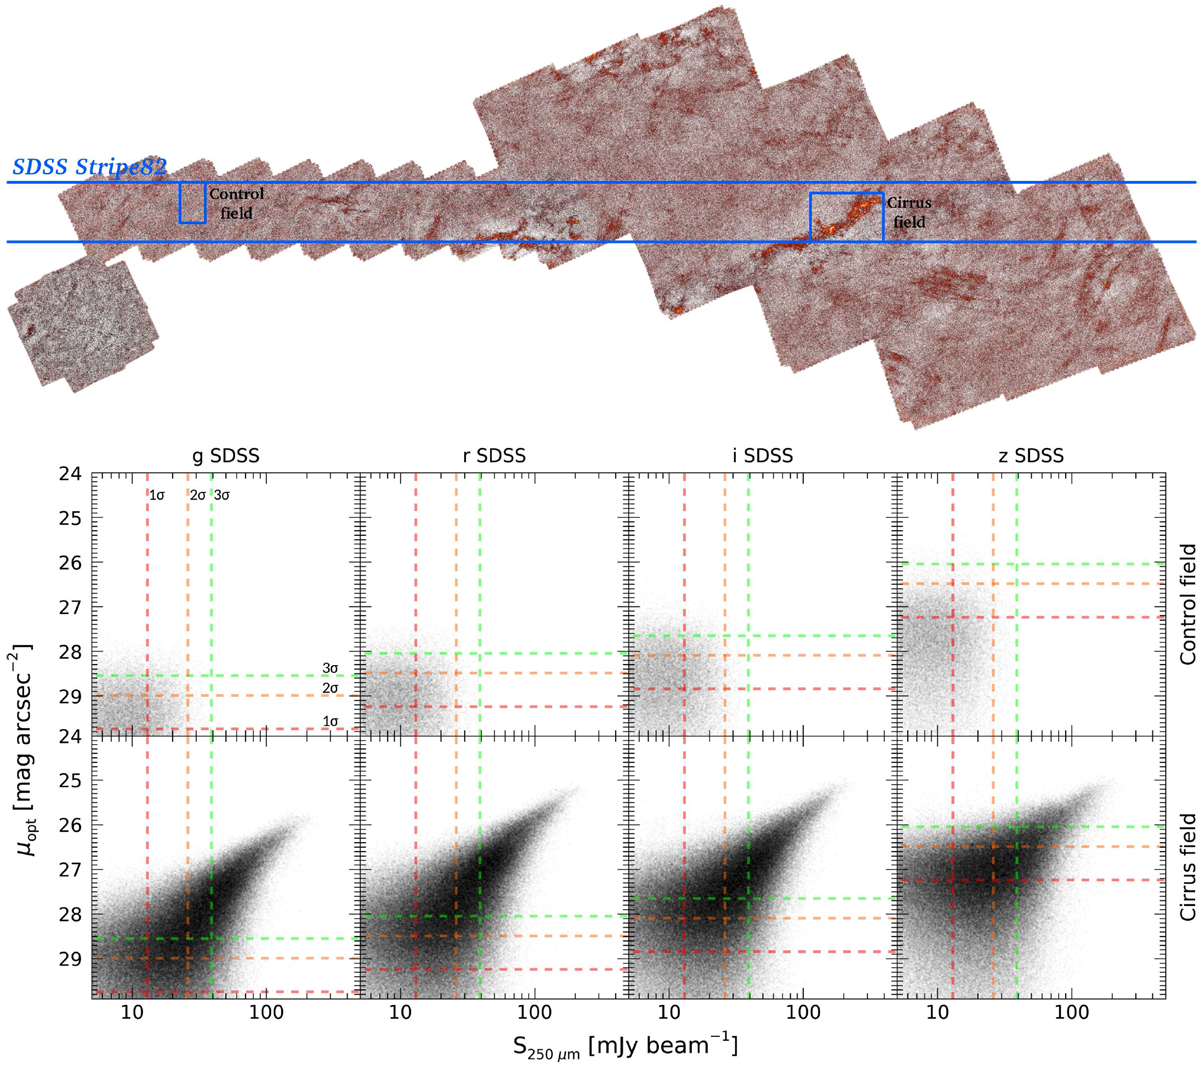
Optical vs. far IR diffuse emission. Upper panel: Herschel Stripe82 survey footprint overlapped with the SDSS Stripe82 footprint. Lower panels: correlation between the diffuse emission in the far IR data and g, r, i and z optical bands for the Control field (upper row) and the Cirrus field (lower row). The dashed red, orange and green lines correspond to the 1σ, 2σ and 3σ detection limits in each band, respectively. The effective area of the beam is 0.994 × 10⁻⁸ steradians (Viero et al. 2013).
Current usage metrics show cumulative count of Article Views (full-text article views including HTML views, PDF and ePub downloads, according to the available data) and Abstracts Views on Vision4Press platform.
Data correspond to usage on the plateform after 2015. The current usage metrics is available 48-96 hours after online publication and is updated daily on week days.
Initial download of the metrics may take a while.