Fig. 12
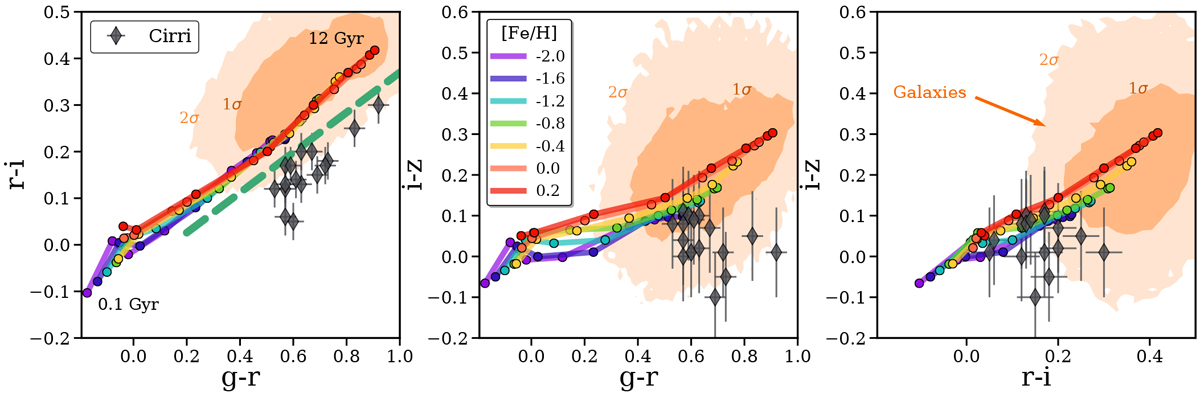
Color-color diagrams of the Galactic cirri and the extragalactic sources. Black diamonds correspond to the cirri colors with their corresponding error bars. Overplotted are E-MILES single stellar population models color-coded for different metallicities at each of the following ages: 0.1, 0.2, 0.5, 1, 2, 5, 10 and 12 Gyr. We also plot the color values of the pixels of real galaxies (see text). The light orange region encloses 95% (2σ) of the pixels,while the dark orange encloses 68% (1σ). The green dashed line in the g-r vs r-i map indicates the separation between the region compatible with dust (below the line) and extragalactic sources (above the line).
Current usage metrics show cumulative count of Article Views (full-text article views including HTML views, PDF and ePub downloads, according to the available data) and Abstracts Views on Vision4Press platform.
Data correspond to usage on the plateform after 2015. The current usage metrics is available 48-96 hours after online publication and is updated daily on week days.
Initial download of the metrics may take a while.