Fig. 10
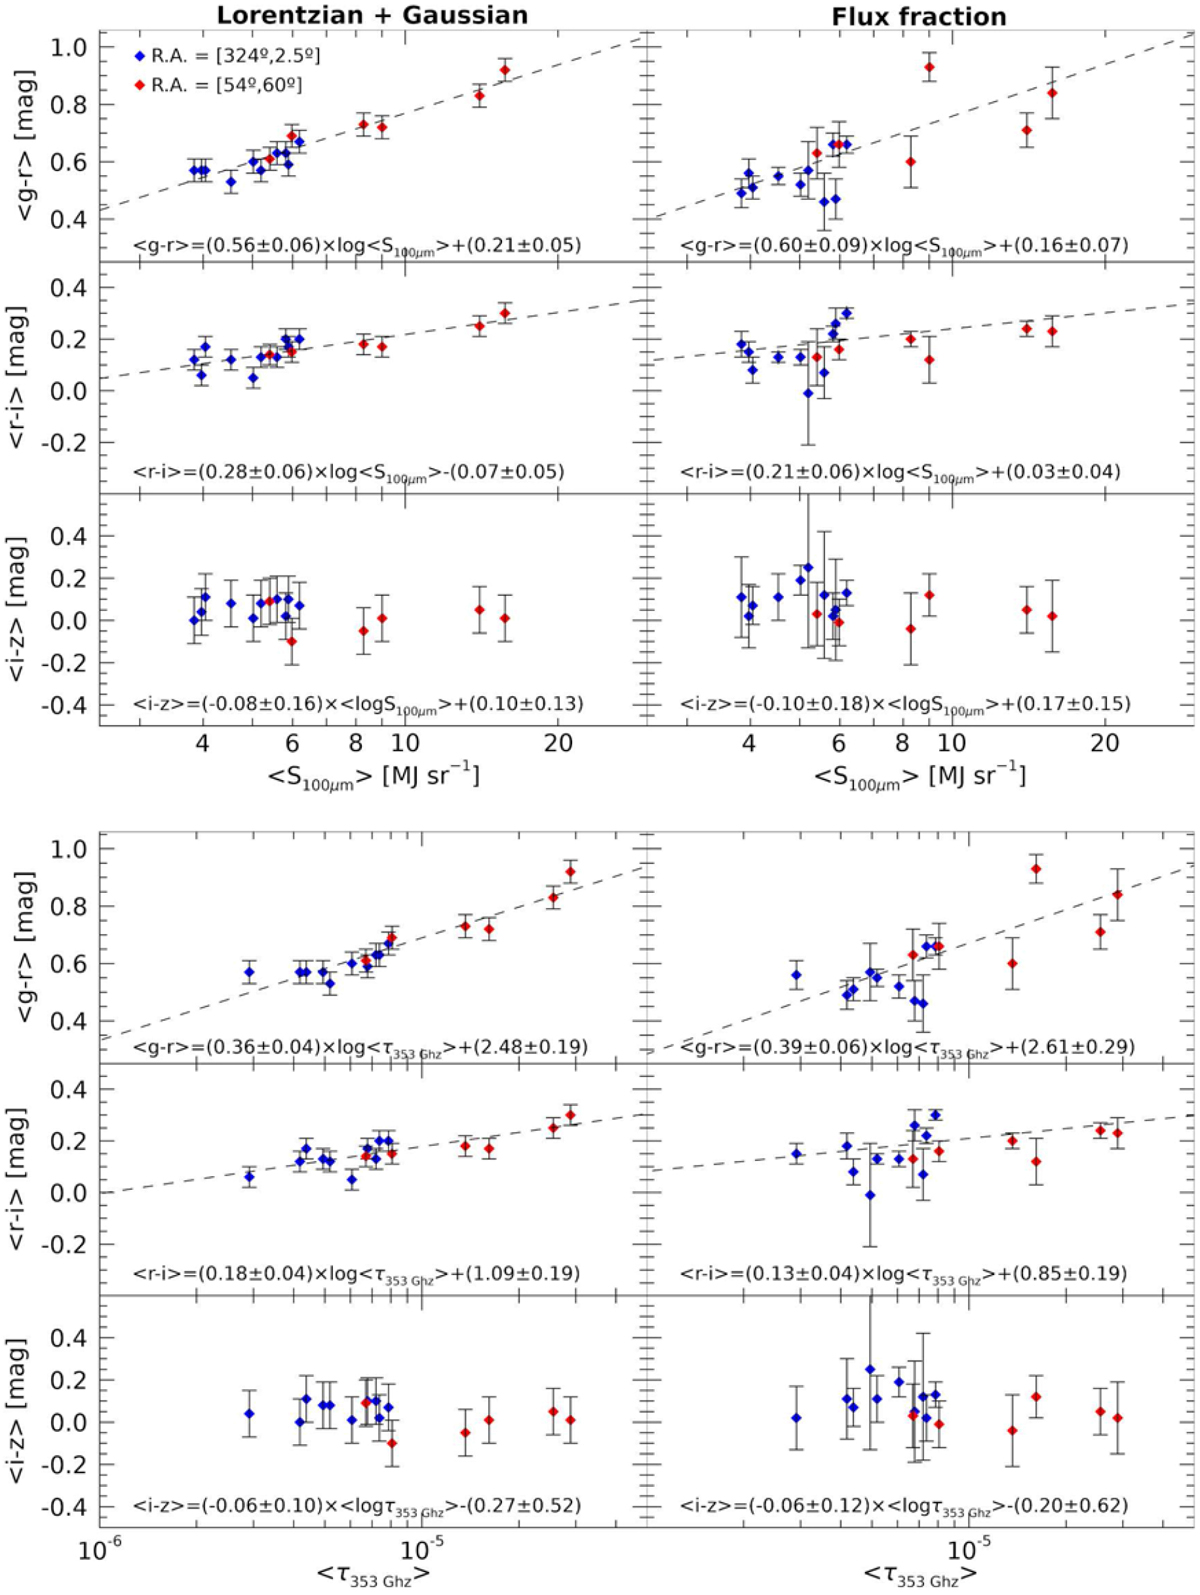
Correlation between the average optical colors of the cirri and the average far IR emission in the 100 μm IRAS band (upper panels) and the Planck dust optical depth at 353 GHz (lower panels). The blue and red diamonds represent fields within different right ascension regions as described in the upper left corner. The error bars show the photometricuncertainty for the optical colors. The dashed lines are the best fits as indicated in the bottom equation of each panel. Panels show the correlations for the two photometric methods used in this work.
Current usage metrics show cumulative count of Article Views (full-text article views including HTML views, PDF and ePub downloads, according to the available data) and Abstracts Views on Vision4Press platform.
Data correspond to usage on the plateform after 2015. The current usage metrics is available 48-96 hours after online publication and is updated daily on week days.
Initial download of the metrics may take a while.