Fig. 1
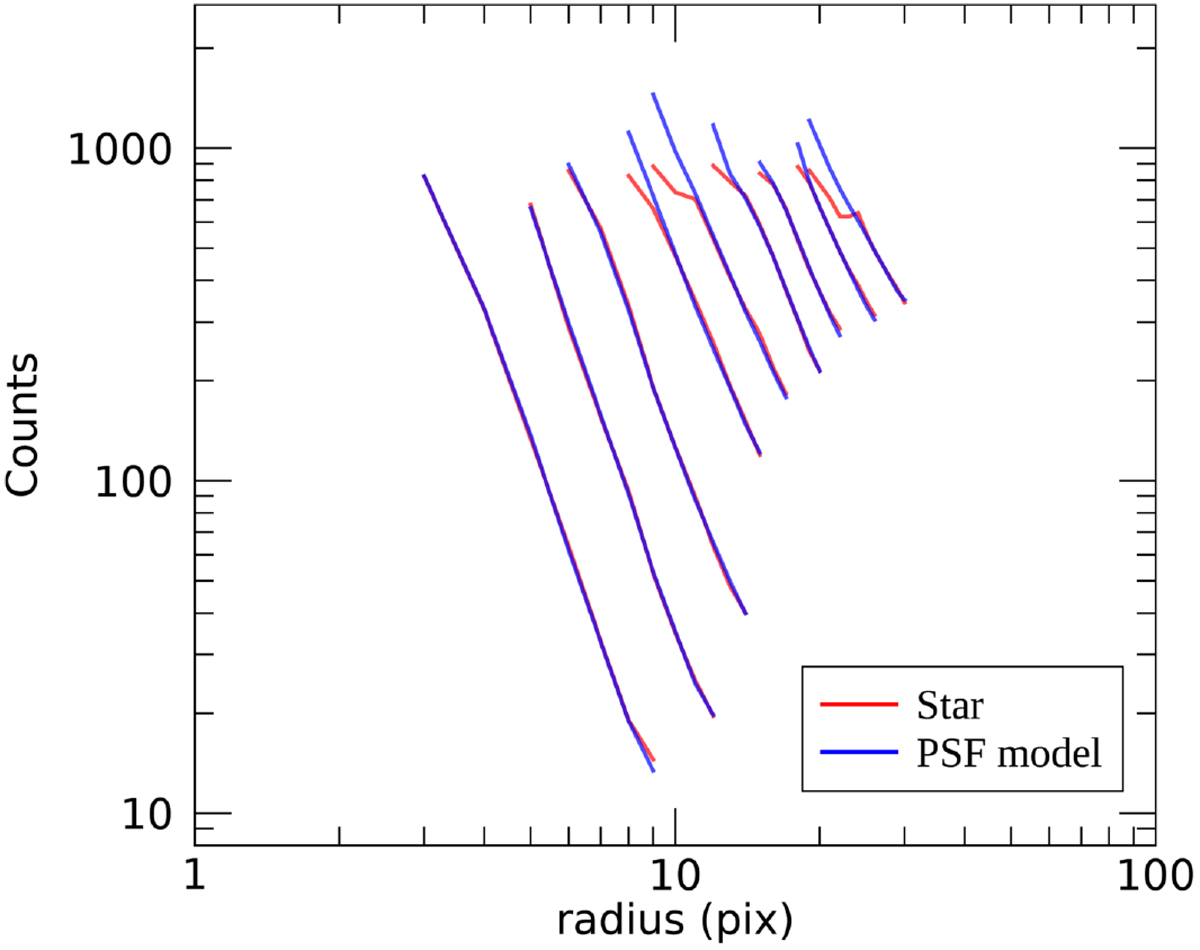
Surface brightness profiles in the g band of real stars together with the fitted PSF models in a random field of the Stripe82 region. The plot shows the profiles of the fitted stars (red) and the profile of the flux scaled PSF models (blue). Nine stars are fitted in this example, with magnitudes ranging approximately between 7.5 and 15.5 in the g band. The profiles cover the radial region used to calculate the flux of each star. The radial region selected for the profile fitting is dynamic for each star and depends on the circumstances of saturation, crowding or magnitude of the star (see main text). We note that the saturation region appears above approximately 800 counts, creating severe deviations from the PSF model in the inner region of the profiles of the brightest stars due to CCD bleeding.
Current usage metrics show cumulative count of Article Views (full-text article views including HTML views, PDF and ePub downloads, according to the available data) and Abstracts Views on Vision4Press platform.
Data correspond to usage on the plateform after 2015. The current usage metrics is available 48-96 hours after online publication and is updated daily on week days.
Initial download of the metrics may take a while.