Free Access
Fig. 3.
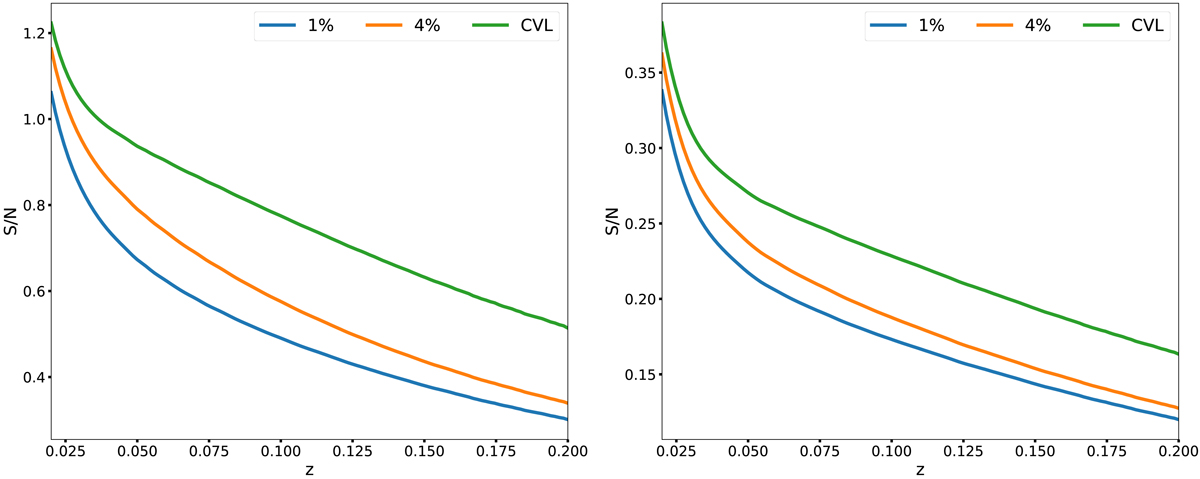
Detection likelihood of the ∝τ2Θ (left) and ∝τ2βt (right) polarized signals from the model cluster for an SO-like telescope. Observation times and corresponding line styles are the same as in Fig. 2. Point source noise contamination is assumed at the deduced upper limit (specified in the text).
Current usage metrics show cumulative count of Article Views (full-text article views including HTML views, PDF and ePub downloads, according to the available data) and Abstracts Views on Vision4Press platform.
Data correspond to usage on the plateform after 2015. The current usage metrics is available 48-96 hours after online publication and is updated daily on week days.
Initial download of the metrics may take a while.