Fig. 4.
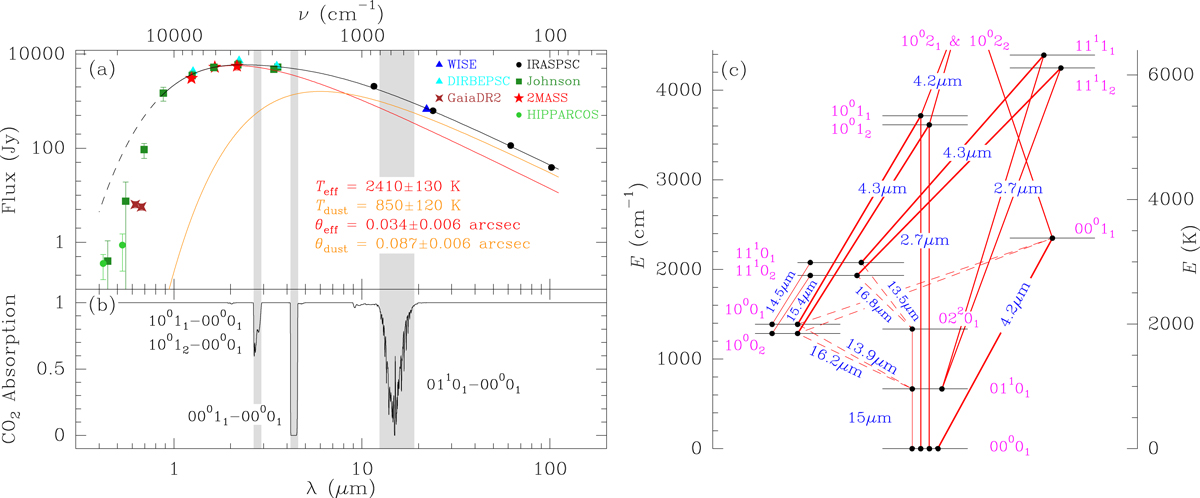
Effect of the continuum emission of R Leo on the vibrational excitation of CO2. a: continuum emission of R Leo based on photometric observations available in several databases. This data set has been fitted with two black-bodies between 0.8 and 100 μm (solid black curve) to represent the star (“eff”) and the dusty component of the envelope (“dust”). The dashed black curve is an extrapolation of this fit below 0.8 μm. The TX and θX are the temperature and the angular diameter of the X emitting region. The vertical gray bands indicate the spectral ranges covered by the strongest CO2 bands. Neither dust opacity nor scattering were considered in our fits. b: low spectral resolution absorption spectrum of CO2 calculated under LTE at a temperature of 1500 K and with a column density of 5 × 1018 cm−2. The strongest bands are highlighted in gray. c: vibrational energy diagram of CO2 with the most important vibrational states involved in the observed bands. The possible vibrational transitions are plotted as red lines, with thickness increasing as their A-Einstein coefficient grows (dashed lines for the lowest coefficients).
Current usage metrics show cumulative count of Article Views (full-text article views including HTML views, PDF and ePub downloads, according to the available data) and Abstracts Views on Vision4Press platform.
Data correspond to usage on the plateform after 2015. The current usage metrics is available 48-96 hours after online publication and is updated daily on week days.
Initial download of the metrics may take a while.