Free Access
Fig. 9.
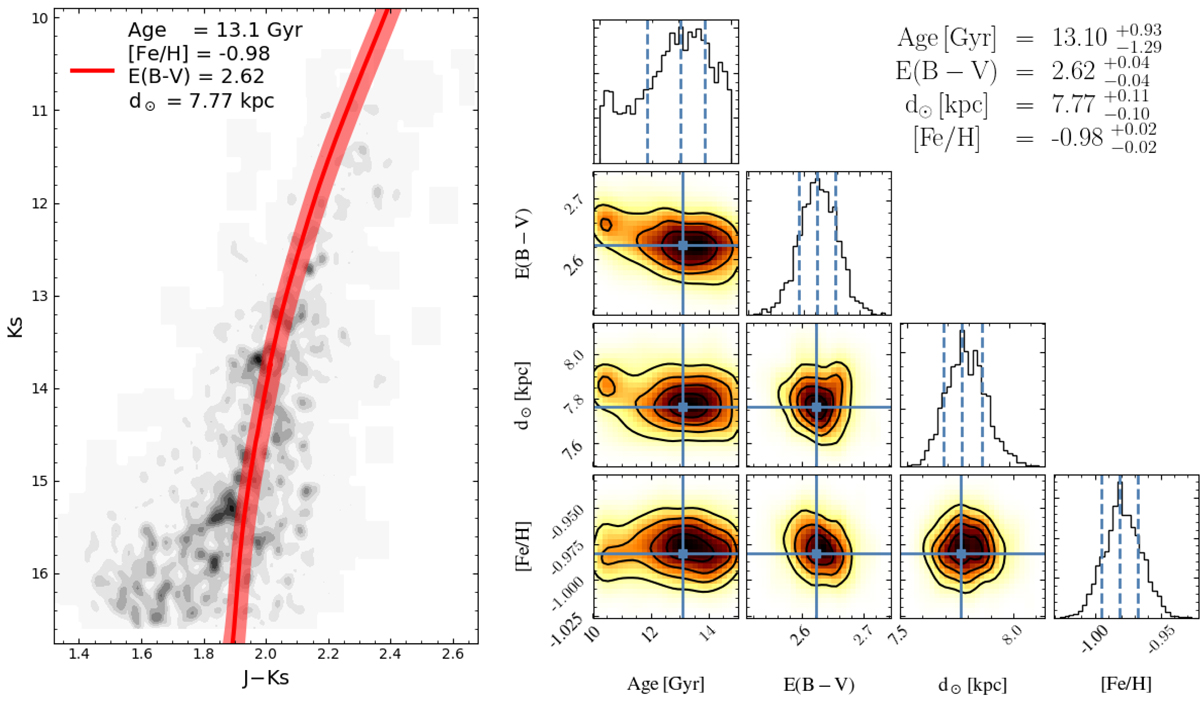
Best isochrone fit in the Ks versus (J − Ks) CMD using DSED models. Left panel: CMD with the results from the fitting. The red line is the most probable solution and the red stripe are the solutions within 1-σ. Right panel: posterior distributions.
Current usage metrics show cumulative count of Article Views (full-text article views including HTML views, PDF and ePub downloads, according to the available data) and Abstracts Views on Vision4Press platform.
Data correspond to usage on the plateform after 2015. The current usage metrics is available 48-96 hours after online publication and is updated daily on week days.
Initial download of the metrics may take a while.