Fig. 5.
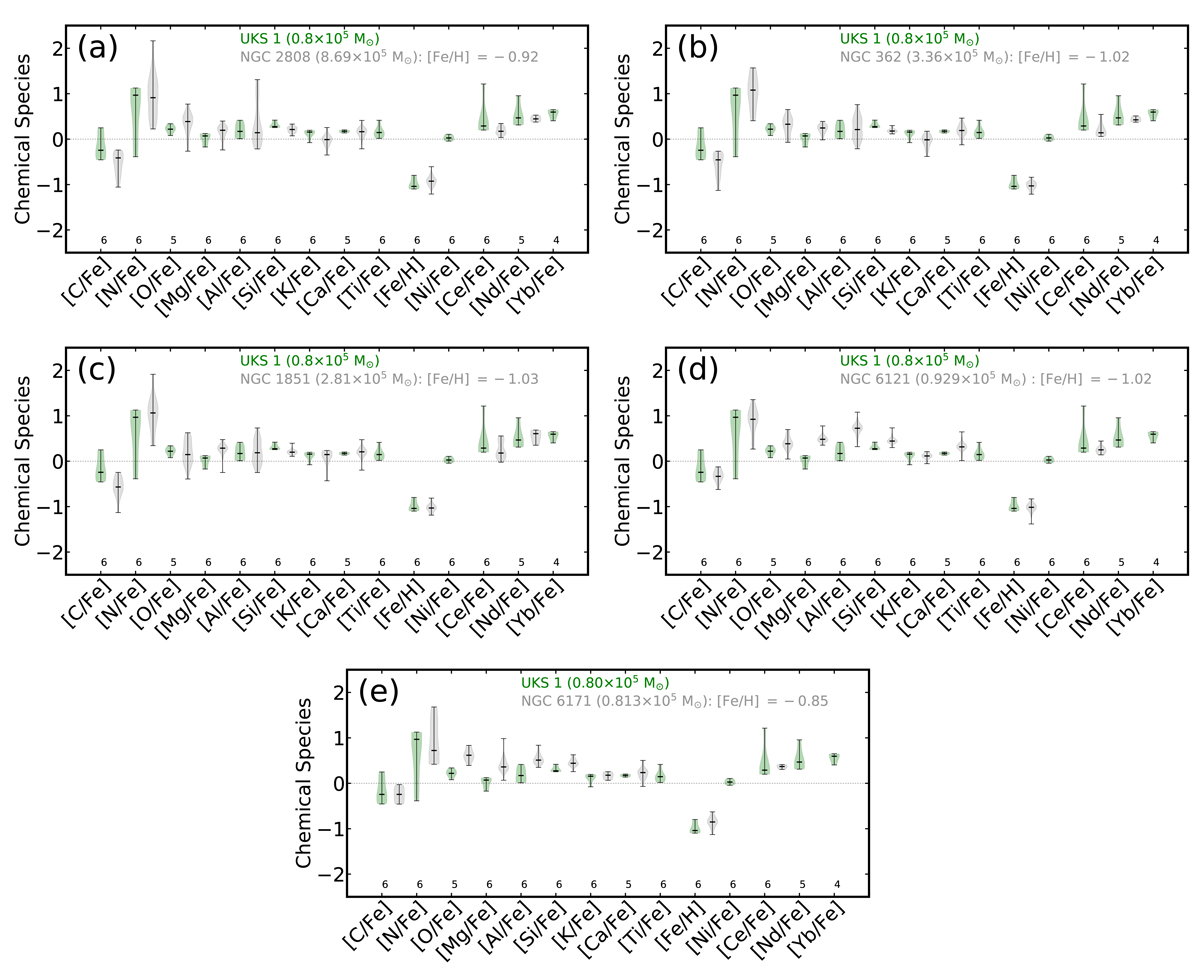
[X/Fe] and [Fe/H] abundance density estimation comparison between UKS 1 (left green symbols) and GCs (right grey symbols), following the constraints outlined in Table 5 from Mészáros et al. (2020). Each violin representation indicates with horizontal lines the median and limits of the distribution. The corresponding number of stars with available abundances in our sample is marked in the bottom labels. The top label indicates the cluster mass from Baumgardt et al. (2019).
Current usage metrics show cumulative count of Article Views (full-text article views including HTML views, PDF and ePub downloads, according to the available data) and Abstracts Views on Vision4Press platform.
Data correspond to usage on the plateform after 2015. The current usage metrics is available 48-96 hours after online publication and is updated daily on week days.
Initial download of the metrics may take a while.