Fig. 4.
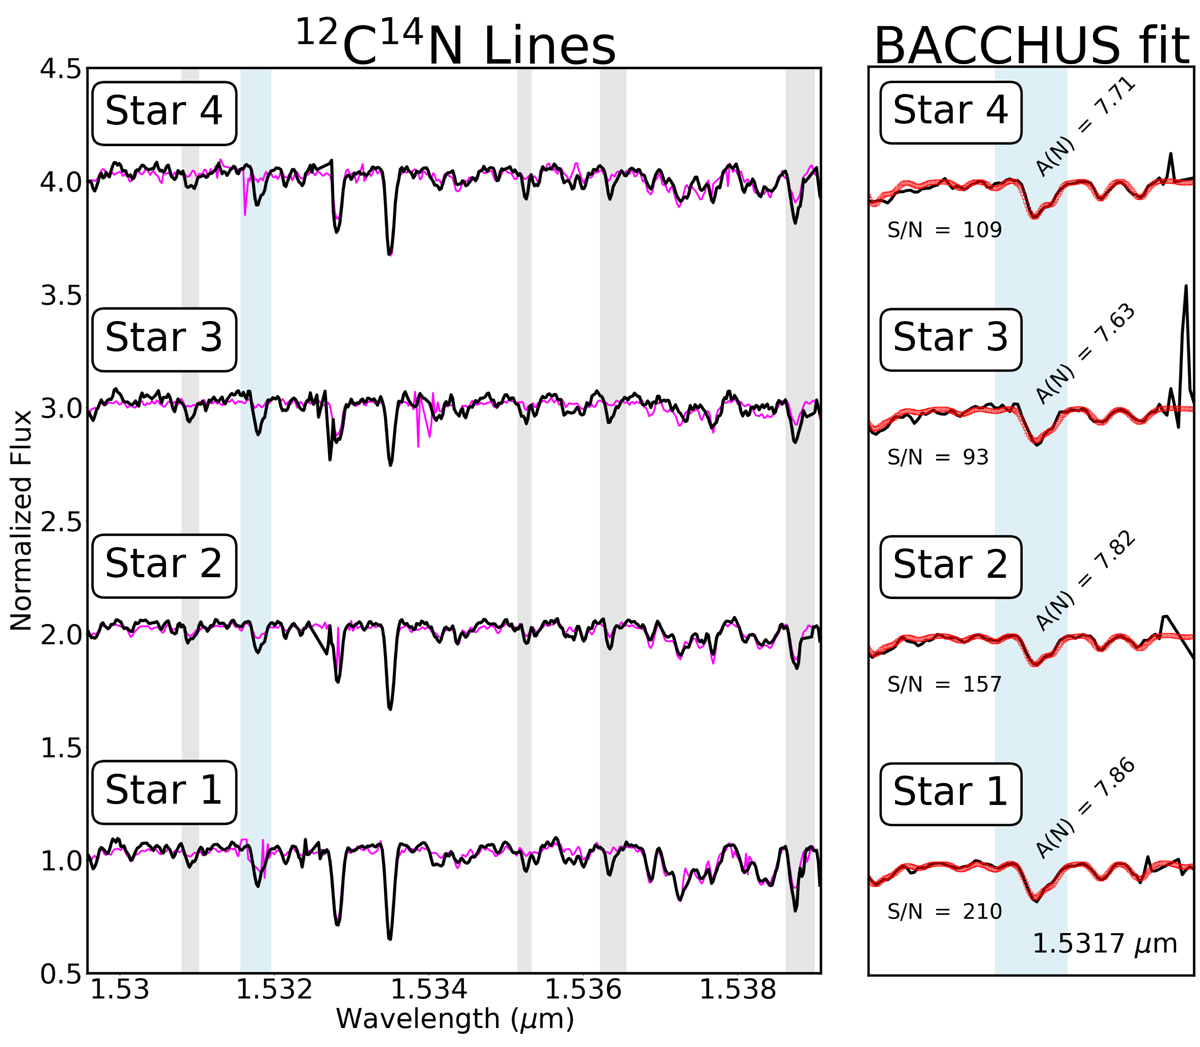
Left: APOGEE spectra (in air wavelength) in a region containing several 12C14N lines, indicated by vertical shaded regions. The magenta line show the spectrum of N-normal stars with similar atmospheric parameters as the N-rich stars. Right: example of our spectral synthesis analysis (red squares) around the line 1.5317 μm (blue light shadow region). The A(N) at 1.5317 μm is marked.
Current usage metrics show cumulative count of Article Views (full-text article views including HTML views, PDF and ePub downloads, according to the available data) and Abstracts Views on Vision4Press platform.
Data correspond to usage on the plateform after 2015. The current usage metrics is available 48-96 hours after online publication and is updated daily on week days.
Initial download of the metrics may take a while.