Fig. 3.
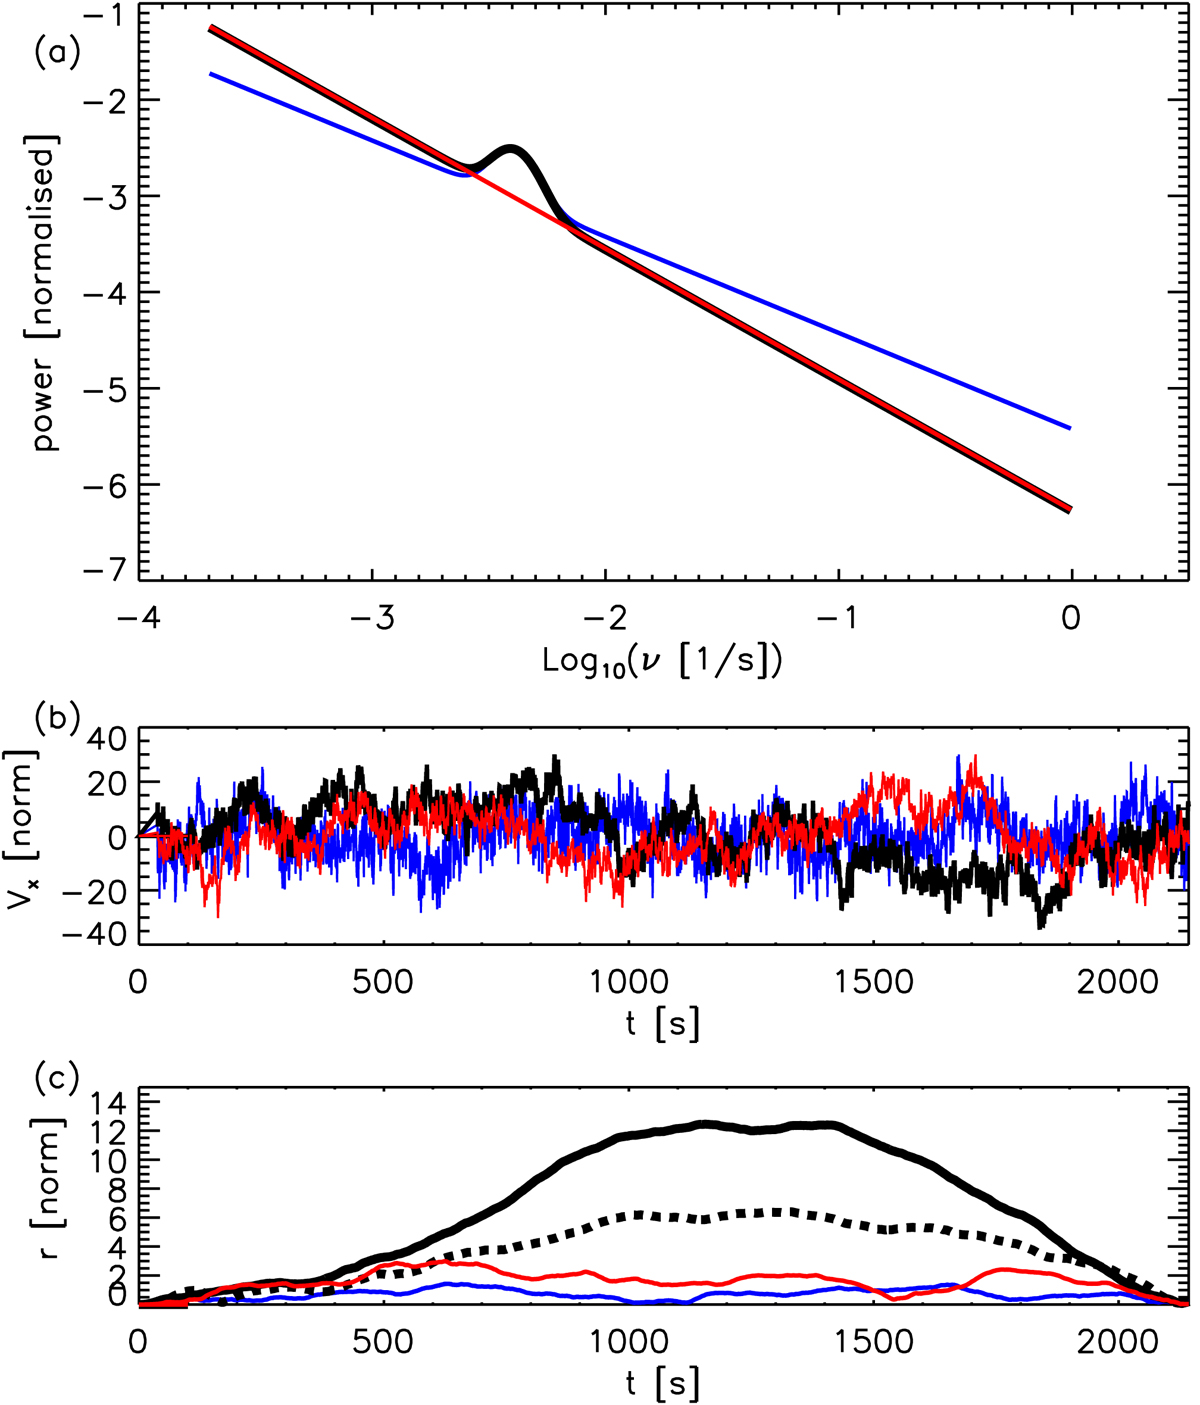
a: spectra for transverse waves used in this study. The black curve represents the averaged observed spectrum, the red curve represents a spectrum where the power enhancement at ν0 = 4 mHz is removed, and the blue curve represents a spectrum where we used a shallower power-law index. b: velocity vx time series for the three spectra in normalised units with the same coloured legend. c: displacement associated with the velocity time series in normalised units and with the same colour legend. The black dashed curve represents the displacement derived from an additional velocity profile obtained from the same observed power spectrum.
Current usage metrics show cumulative count of Article Views (full-text article views including HTML views, PDF and ePub downloads, according to the available data) and Abstracts Views on Vision4Press platform.
Data correspond to usage on the plateform after 2015. The current usage metrics is available 48-96 hours after online publication and is updated daily on week days.
Initial download of the metrics may take a while.