Free Access
Fig. 21.
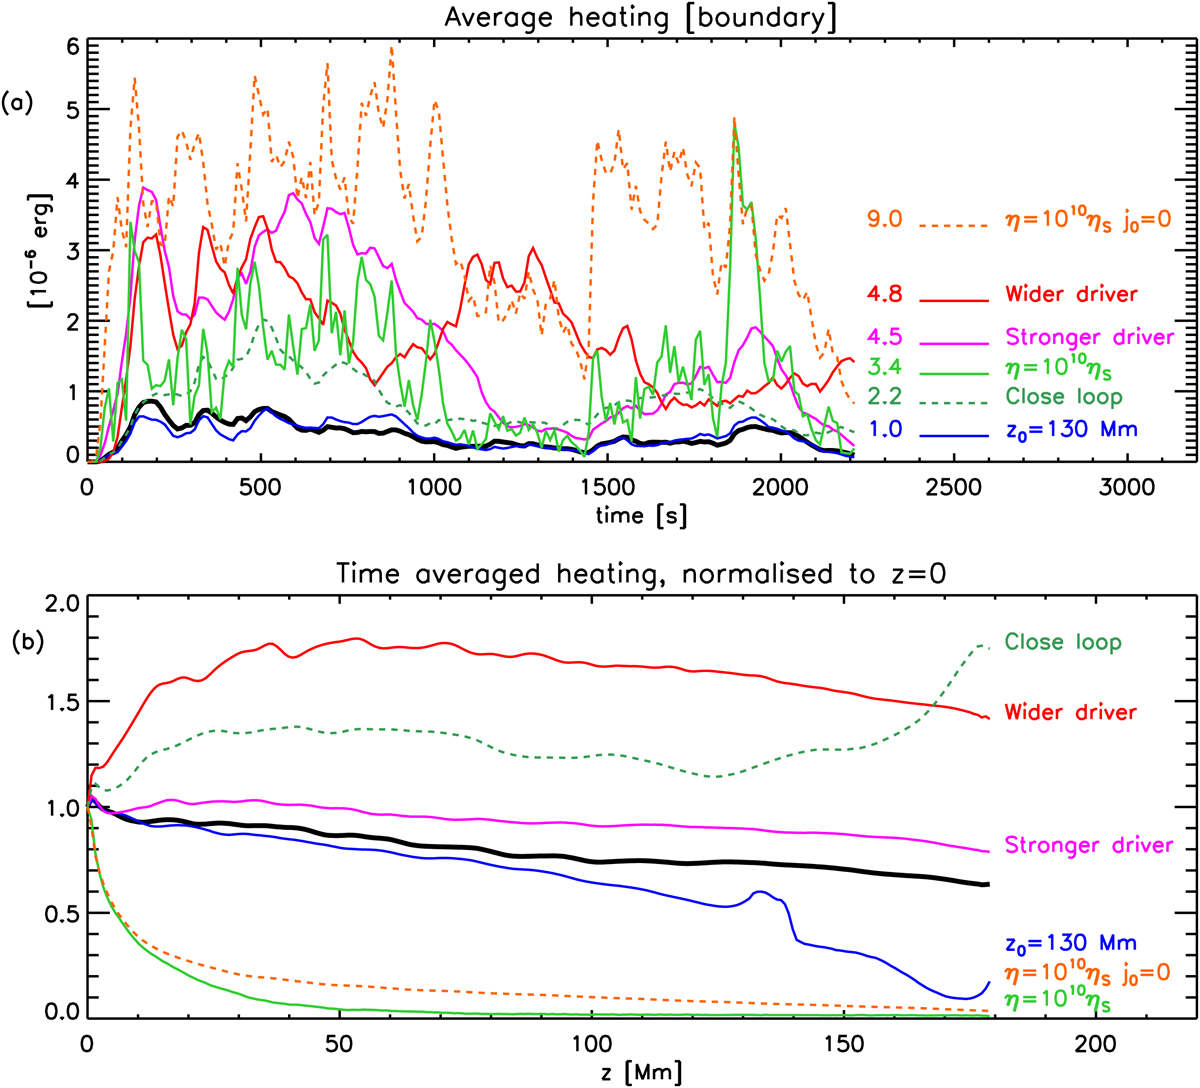
a: average heating in boundary shell as a function of time for a number of simulations listed in the colour legend, with the average heating enhancement reported. b: average heating in the boundary shell as a function of position along the loop for the same simulations normalised to the average heating at z = 0.
Current usage metrics show cumulative count of Article Views (full-text article views including HTML views, PDF and ePub downloads, according to the available data) and Abstracts Views on Vision4Press platform.
Data correspond to usage on the plateform after 2015. The current usage metrics is available 48-96 hours after online publication and is updated daily on week days.
Initial download of the metrics may take a while.