Fig. D.1.
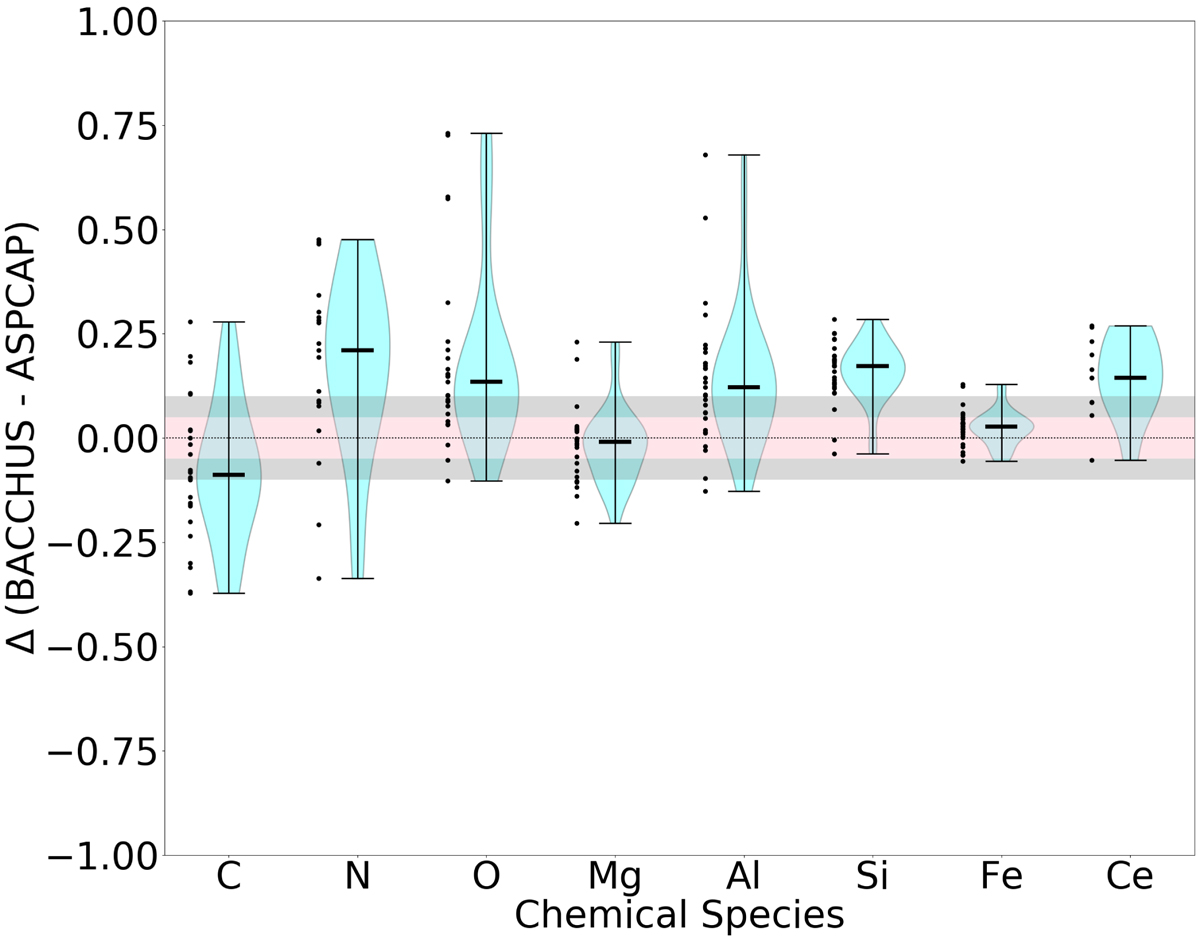
Violin diagram showing the differences between the derived elemental abundances between our analysis with the BACCHUS code against those values of the ASPCAP pipeline for our 29 Al-rich stars. Each violin representation indicates with horizontal lines the median and limits of the distribution. The horizontal shaded regions show the typical errors of +0.05 dex, and +0.1 dex found by the ASPCAP pipeline.
Current usage metrics show cumulative count of Article Views (full-text article views including HTML views, PDF and ePub downloads, according to the available data) and Abstracts Views on Vision4Press platform.
Data correspond to usage on the plateform after 2015. The current usage metrics is available 48-96 hours after online publication and is updated daily on week days.
Initial download of the metrics may take a while.