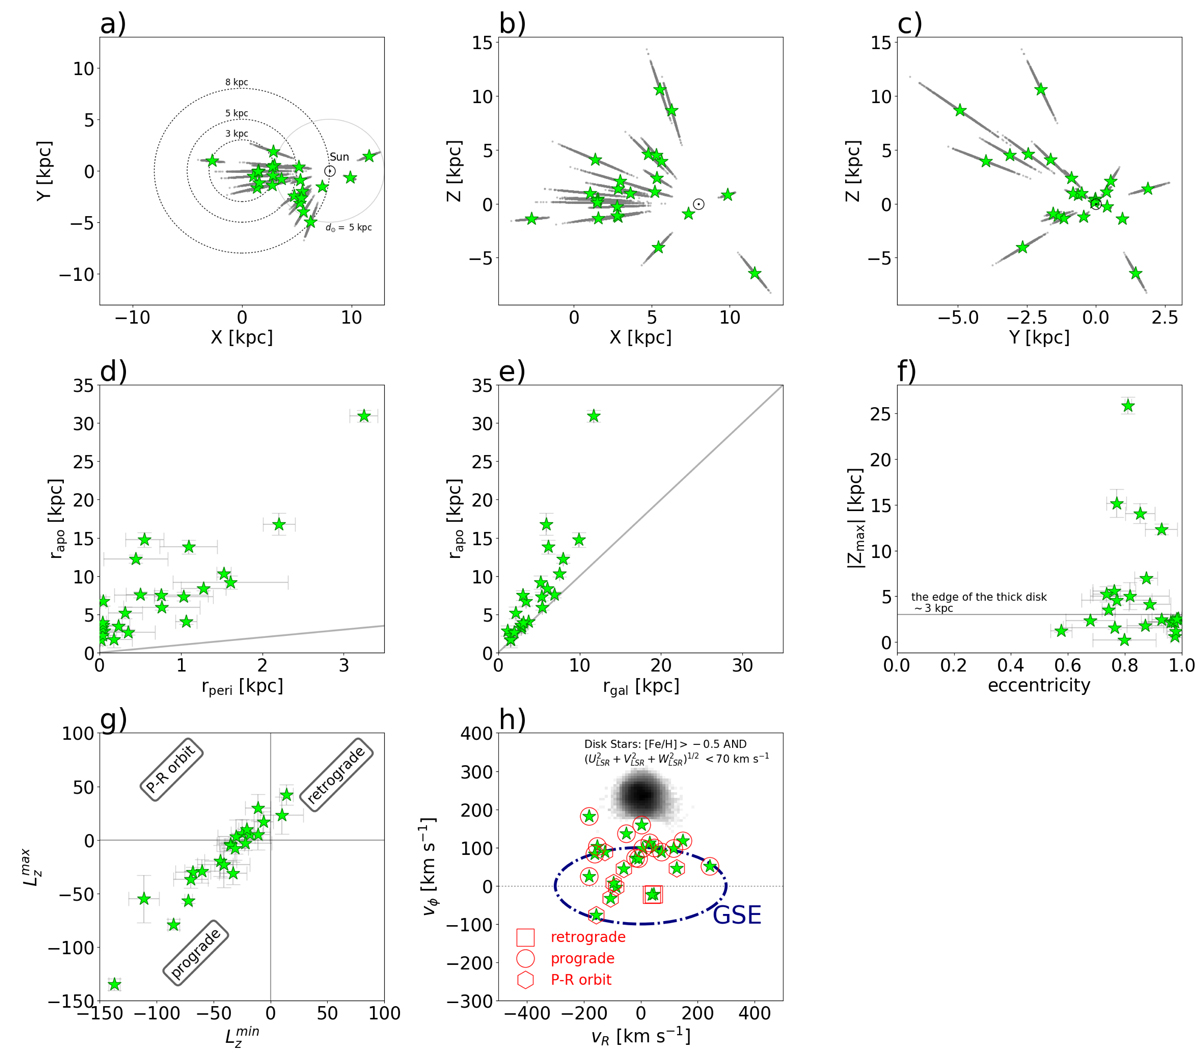
Fig. C.1.

Panels a–c: Galactic location of the Al-rich stars (lime star symbols). The aligned grey points show the results of 1000 Monte Carlo resampling incorporating measurement errors. The orbital elements are shown in panels d–g. The straight lines in panels d and e indicate the one-to-one line. For panel d, a star on this line would have a circular orbit, and in panel e, a star on this line is being observed at apocentre. The horizontal line in panel f indicates the approximate edge of the thick disc according to Carollo et al. (2010). The type of orbital configuration of each star is shown in panel g. The median of the orbital parameters for each star is shown with their respective 16th and 84th percentiles (error bars) obtained for the model with the bar having Ωbar = 41 km s−1 kpc−1. The distribution of the velocity components vθ vs. vR for the studied Al-rich stars is shown in panel h. The blue dashed line represents the approximate region for stars associated with Gaia-Sausage in vθ vs. vR space based on Belokurov et al. (2018). In addition, a 2D heat map (grey) of the densely distributed disc stars from APOGEE DR16 is shown for comparison. The unfilled red symbols in panel h mark the type of orbital configuration.
Current usage metrics show cumulative count of Article Views (full-text article views including HTML views, PDF and ePub downloads, according to the available data) and Abstracts Views on Vision4Press platform.
Data correspond to usage on the plateform after 2015. The current usage metrics is available 48-96 hours after online publication and is updated daily on week days.
Initial download of the metrics may take a while.


