Fig. C.1
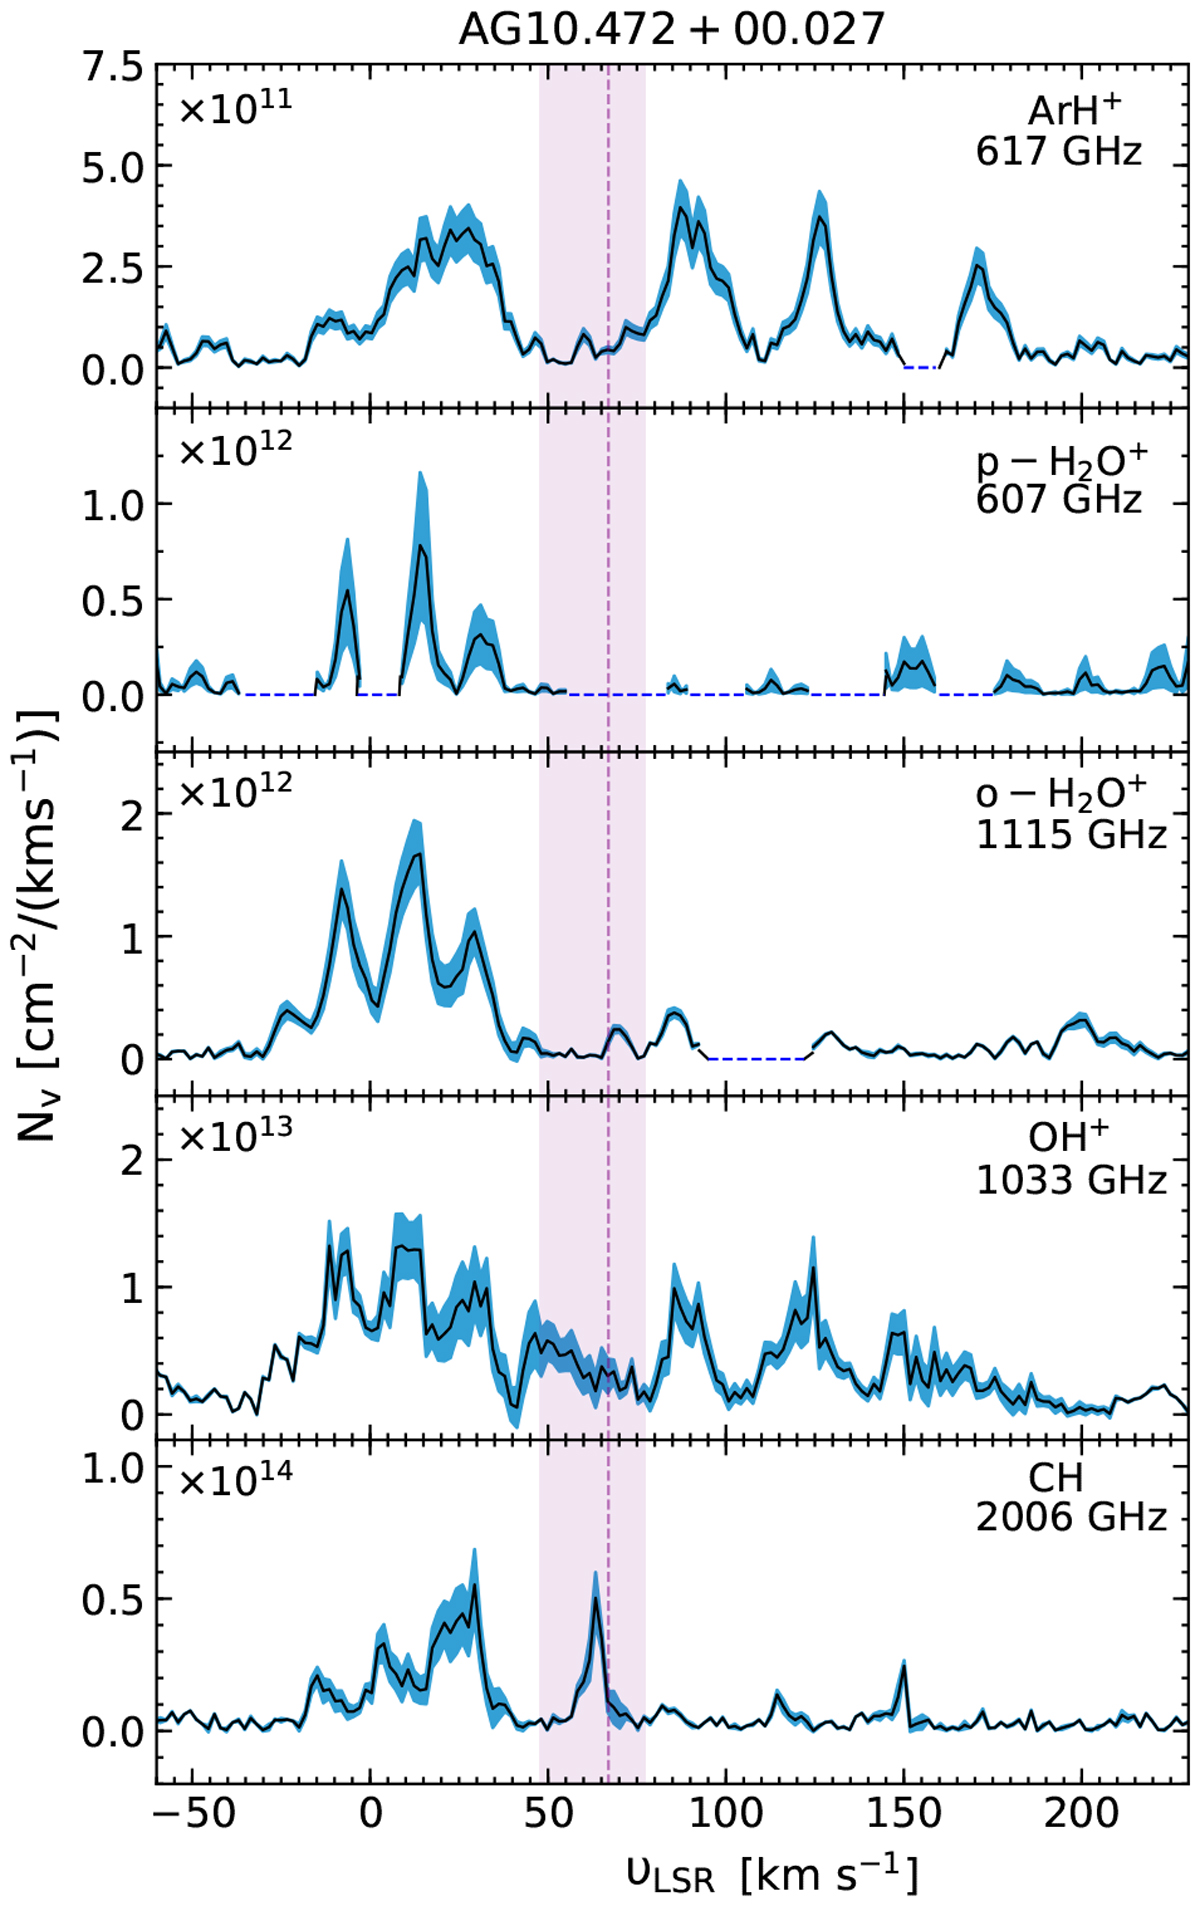
Topto bottom: Column density per velocity channel of ArH+, p-H2O+, o-H2O+, OH+, and CH towards G10.472+00.027. The blue shaded region represents the uncertainties while the pink dashed line, and shaded region mark the systemic velocity of the source and highlight the velocity dispersion of the source. The dashed blue lines indicate those velocity intervals that were omitted from the fitting routine due to contamination.
Current usage metrics show cumulative count of Article Views (full-text article views including HTML views, PDF and ePub downloads, according to the available data) and Abstracts Views on Vision4Press platform.
Data correspond to usage on the plateform after 2015. The current usage metrics is available 48-96 hours after online publication and is updated daily on week days.
Initial download of the metrics may take a while.