Open Access
Fig. B.1
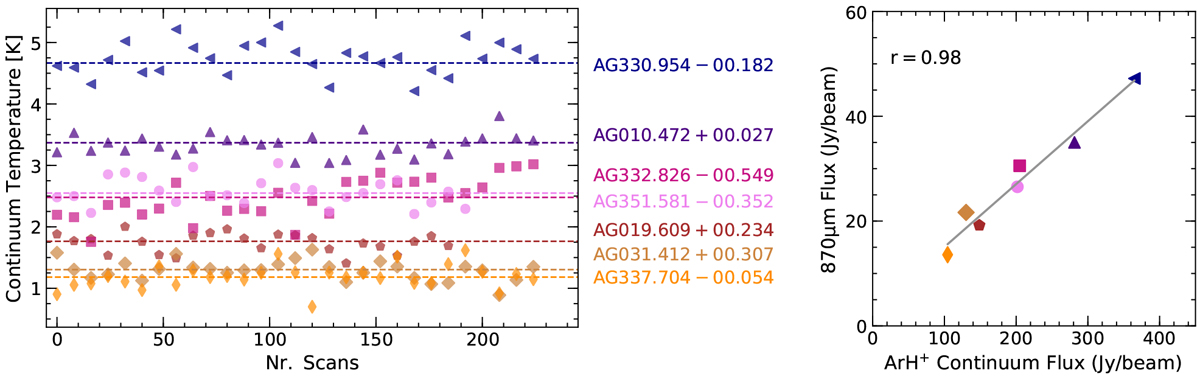
Left: Continuum fluctuations across scans. The dashed lines represent the median continuum level for each source. Right: Correlation between the observed ArH+ continuum flux and the 870 μm continuum flux.
Current usage metrics show cumulative count of Article Views (full-text article views including HTML views, PDF and ePub downloads, according to the available data) and Abstracts Views on Vision4Press platform.
Data correspond to usage on the plateform after 2015. The current usage metrics is available 48-96 hours after online publication and is updated daily on week days.
Initial download of the metrics may take a while.