Fig. 2
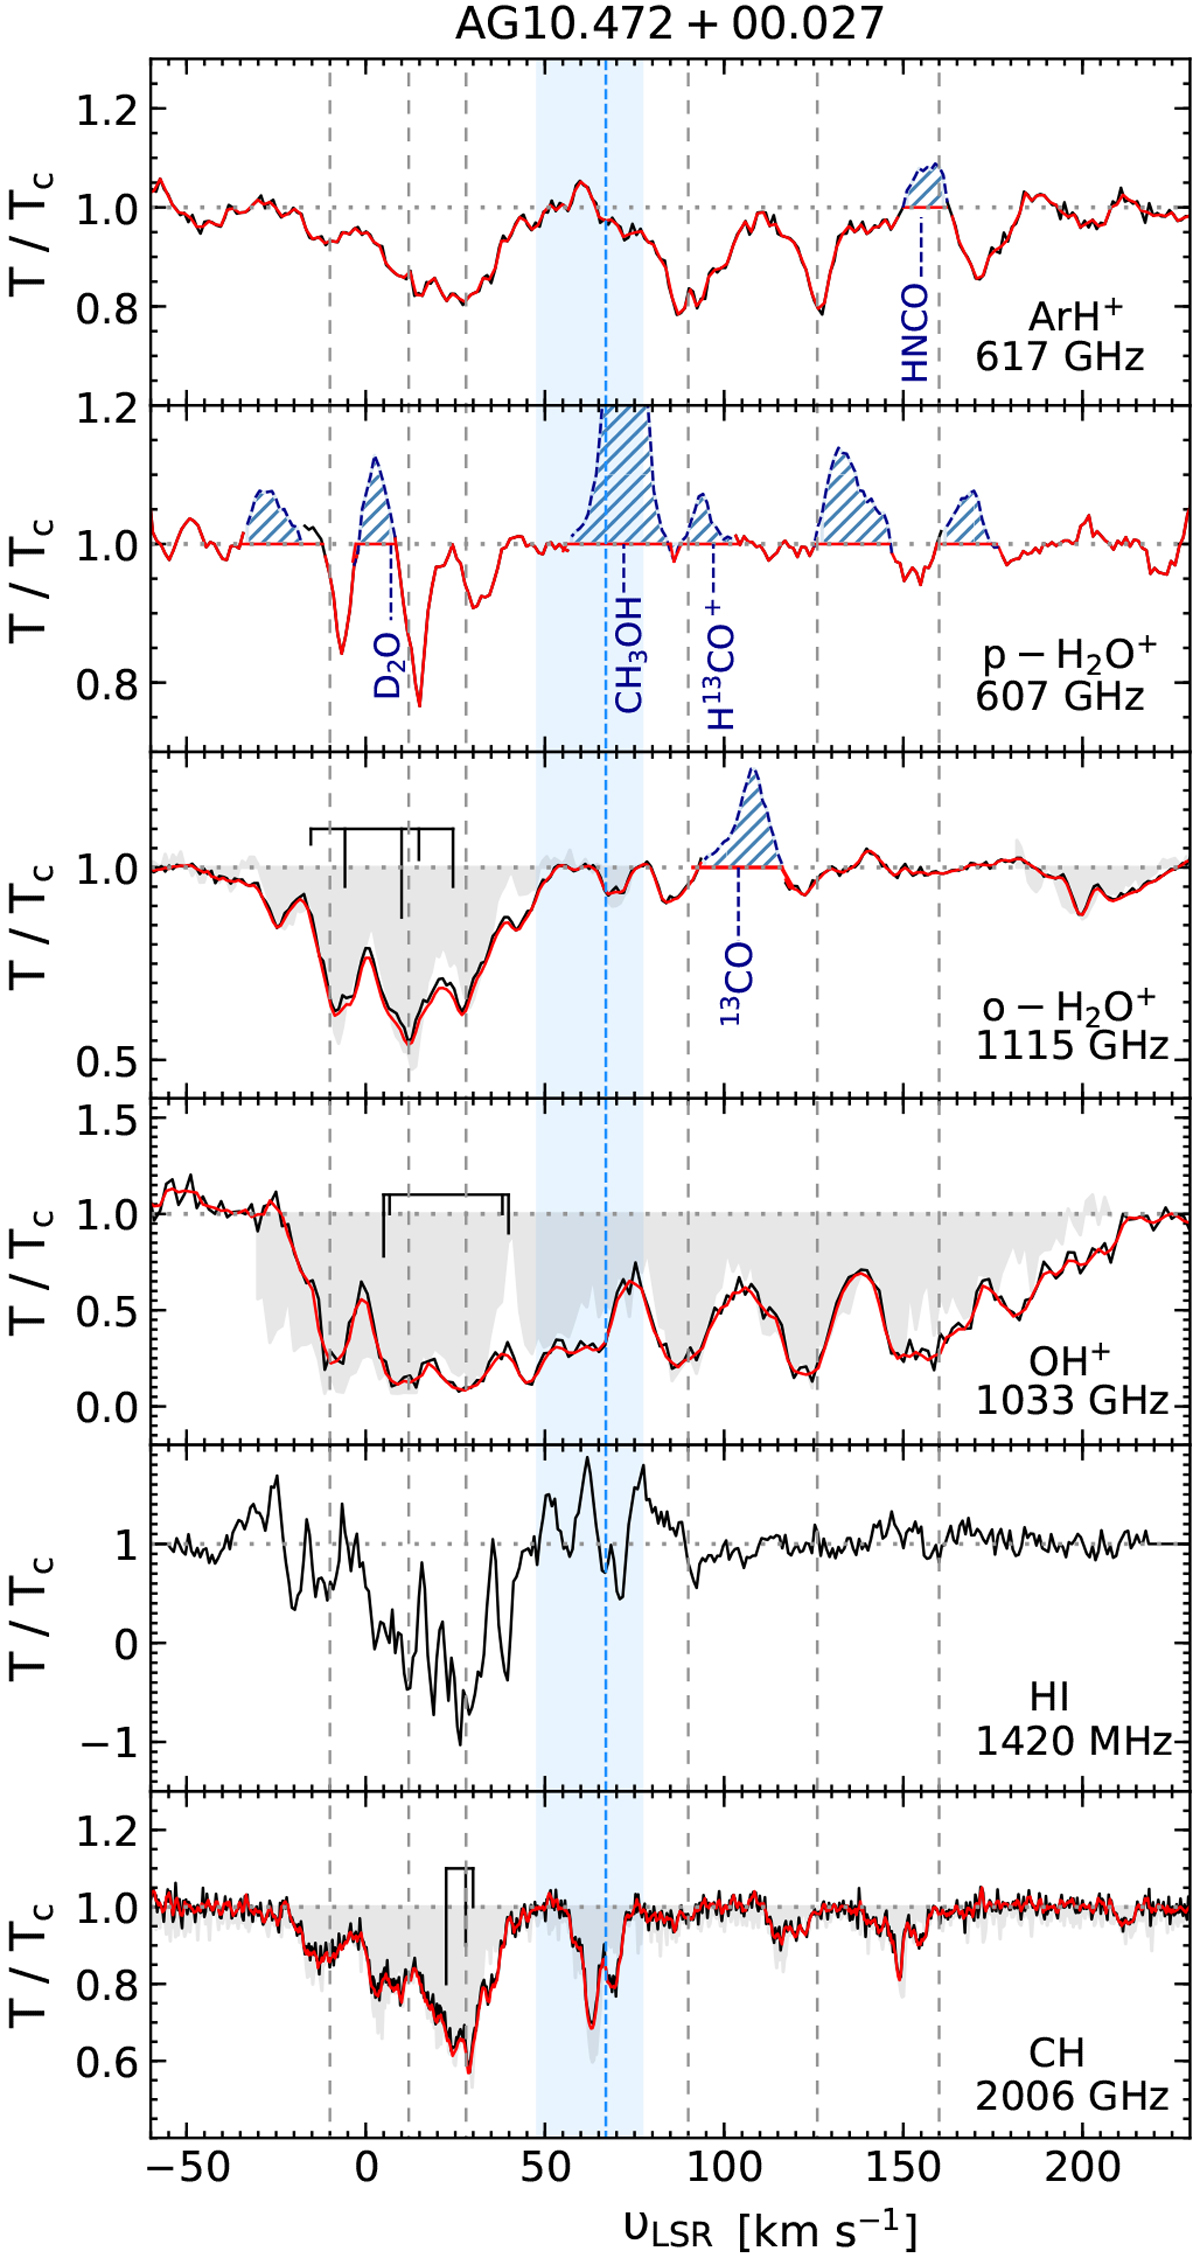
From top to bottom: Normalised spectra showing transitions of ArH+, p-H2O+, o-H2O+, OH+, HI, and CH, towards AG10.472+00.027, in black. The vertical dashed blue line and blue shaded regions mark the systemic velocity and the typical velocity dispersion of the source. The vertical dashed grey lines indicate the main absorption dips. Red curves display the Wiener filter fit to the observed spectra except for the HI spectra. The relative intensities of the hyperfine structure (hfs) components of the o-H2O+ and the OH+ and CH transitions are shown in black above their respective spectra and the grey shaded regions display their hfs deconvolvedspectra. Contaminating emission features are marked by the blue hatched lines and are excluded from the modelled fit and analysis.
Current usage metrics show cumulative count of Article Views (full-text article views including HTML views, PDF and ePub downloads, according to the available data) and Abstracts Views on Vision4Press platform.
Data correspond to usage on the plateform after 2015. The current usage metrics is available 48-96 hours after online publication and is updated daily on week days.
Initial download of the metrics may take a while.