Fig. 15
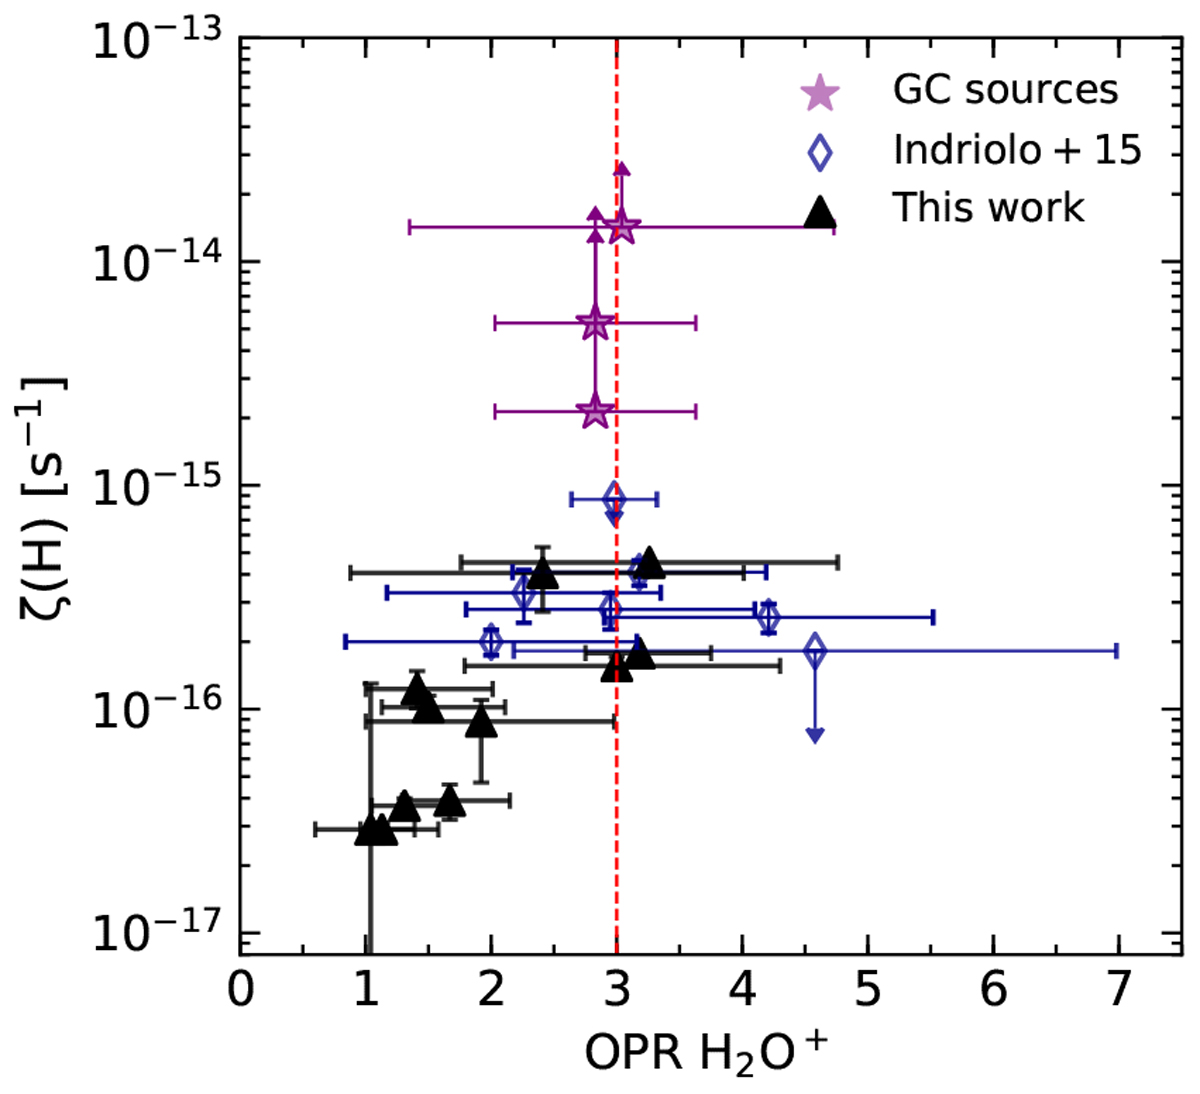
Observed OPR of H2O+ vs. the cosmic-ray ionisation rates derived using the steady state analysis of the OH+ and H2O+. The results from this work are marked by black triangles while those from Indriolo et al. (2015) are displayed by blue diamonds. For comparison we display the OPR of H2O+ derived by these authors towards GC sight lines using purple stars. The dashed red line marks the equilibrium OPR value of three.
Current usage metrics show cumulative count of Article Views (full-text article views including HTML views, PDF and ePub downloads, according to the available data) and Abstracts Views on Vision4Press platform.
Data correspond to usage on the plateform after 2015. The current usage metrics is available 48-96 hours after online publication and is updated daily on week days.
Initial download of the metrics may take a while.