Open Access
Fig. 14
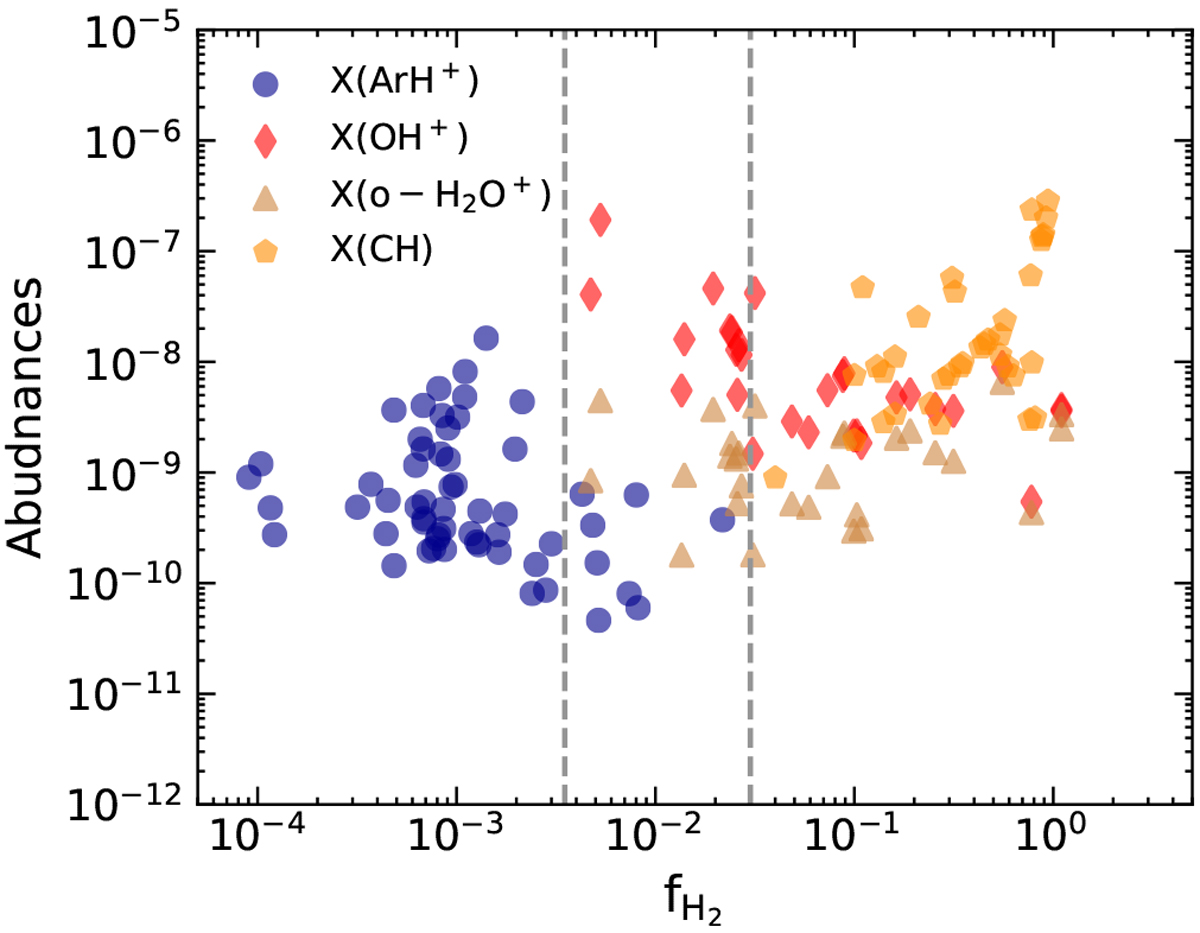
Molecular abundances with respect to atomic hydrogen as a function of molecular gas fraction (![]() ). The blue circles, red diamonds, tan triangles, and yellow pentagons represent the abundances of ArH+, OH+, H2O+, and CH, respectively. The dashed grey lines enclose within them the cloud layers traced by ArH+, OH+, and H2O+.
). The blue circles, red diamonds, tan triangles, and yellow pentagons represent the abundances of ArH+, OH+, H2O+, and CH, respectively. The dashed grey lines enclose within them the cloud layers traced by ArH+, OH+, and H2O+.
Current usage metrics show cumulative count of Article Views (full-text article views including HTML views, PDF and ePub downloads, according to the available data) and Abstracts Views on Vision4Press platform.
Data correspond to usage on the plateform after 2015. The current usage metrics is available 48-96 hours after online publication and is updated daily on week days.
Initial download of the metrics may take a while.