Fig. 13
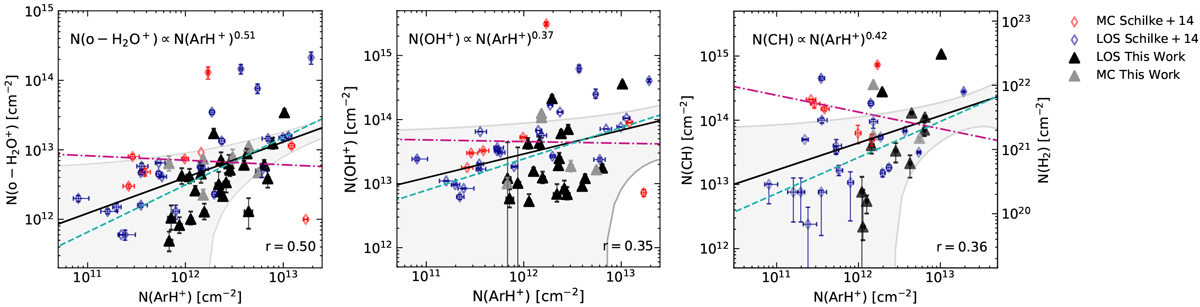
Comparison of the ArH+ column density to that of o-H2O+ (left), OH+ (centre), and CH (right). Black and grey filled triangles indicate the column density values derived within velocity intervals corresponding to LOS absorption and molecular cloud (MC) towards the Galactic sources presented in this study. Additionally, the blue and red unfilled diamonds mark the LOS and MC column densities derived towards the sources discussed in Schilke et al. (2014). The solid black curve represents the best fit to the combined data set including both the LOS and MC components with the grey shaded region displaying the 1 σ interval of the weighted regression. The dashed cyan and dashed-dotted pink curves represent the fits to only the LOS and only the MC components, respectively.
Current usage metrics show cumulative count of Article Views (full-text article views including HTML views, PDF and ePub downloads, according to the available data) and Abstracts Views on Vision4Press platform.
Data correspond to usage on the plateform after 2015. The current usage metrics is available 48-96 hours after online publication and is updated daily on week days.
Initial download of the metrics may take a while.