Fig. 10
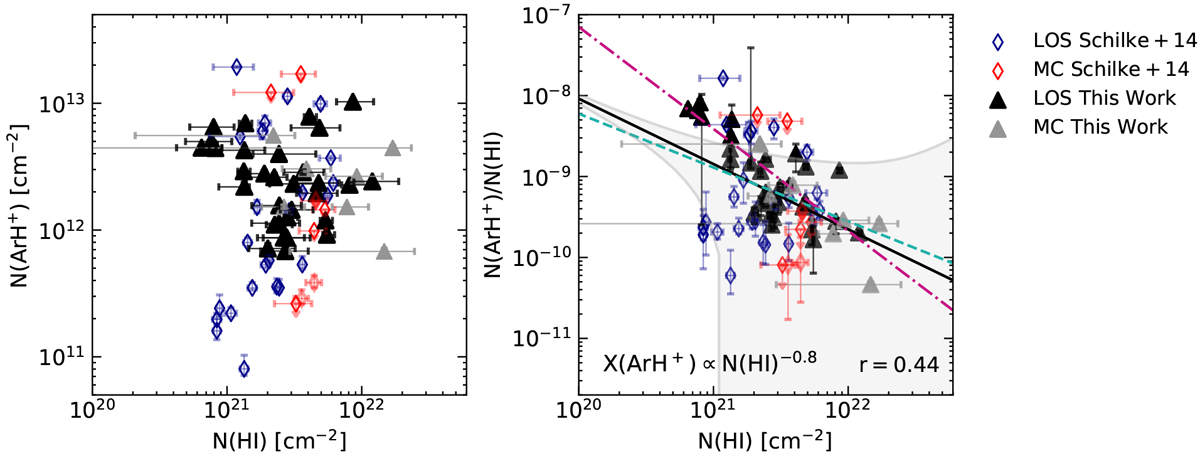
Left: N(ArH+) vs. N(H). Right: X(ArH+) = N(ArH+)∕N(Hi) vs. N(H). The data points include column density values derived towards the MC and LOS features from our sample of sources indicated by filled grey and black triangles, as well as those from Schilke et al. (2014) marked by unfilled red and blue diamonds, respectively. The solid black line displays the power-law relation to the combined data-set,
![]() , with the grey shaded region representing the 1σ-level of the weighted fit. The dashed cyan and dashed-dotted pink curves represent the fits to only the LOS and only the MC components, respectively.
, with the grey shaded region representing the 1σ-level of the weighted fit. The dashed cyan and dashed-dotted pink curves represent the fits to only the LOS and only the MC components, respectively.
Current usage metrics show cumulative count of Article Views (full-text article views including HTML views, PDF and ePub downloads, according to the available data) and Abstracts Views on Vision4Press platform.
Data correspond to usage on the plateform after 2015. The current usage metrics is available 48-96 hours after online publication and is updated daily on week days.
Initial download of the metrics may take a while.