Fig. 3
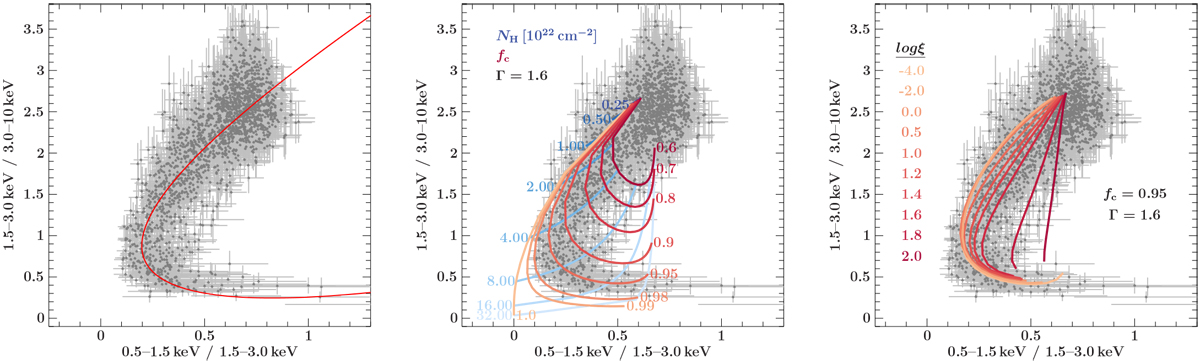
Comparison of the color–color diagrams of the Chandra observation ObsID 3814 using the MEG M1 arm with different models. Left: empirical polynomial fit. Middle: neutral grid using the tbabs absorption model for different covering fractions and the same continuum photon index Γ = 1.6. Right: homogeneously ionized absorber using the warmabs model with continuum photon index Γ = 1.6 and a covering fraction of 0.95. The equivalent absorbing column density,NH, changes from 0.25 × 10⁻²² cm−2 to 32 × 10−22 cm−2 along each line, with each line showing the track for a different ionization parameter log ξ as indicated by the different colors.
Current usage metrics show cumulative count of Article Views (full-text article views including HTML views, PDF and ePub downloads, according to the available data) and Abstracts Views on Vision4Press platform.
Data correspond to usage on the plateform after 2015. The current usage metrics is available 48-96 hours after online publication and is updated daily on week days.
Initial download of the metrics may take a while.