Fig. 6.
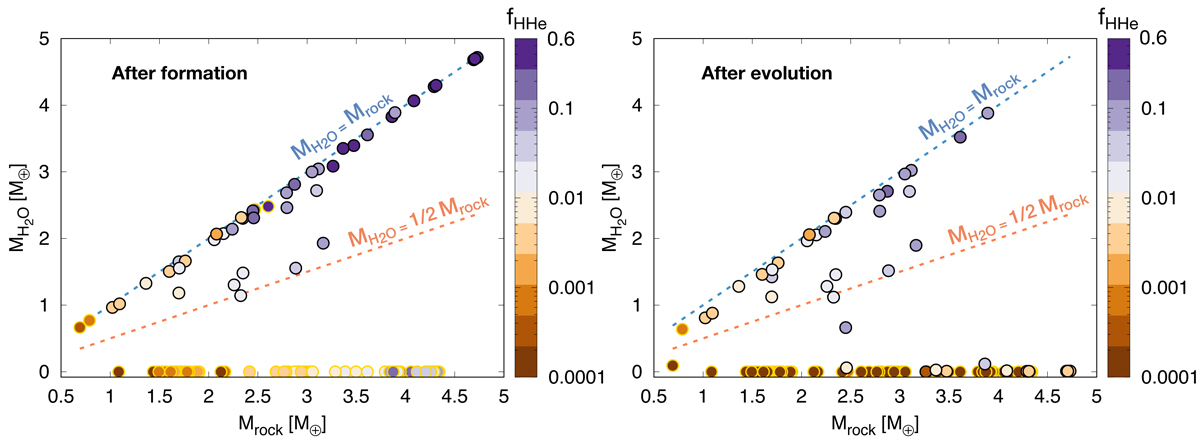
Bulk water versus rock content after formation (left) and after evolution (right) for Model B. The colour-bar indicates the planet H-He mass fraction at each corresponding epoch. Yellow-line circles represent cases that end up in the first peak (1 < RP ≤ 1.7 R⊕) and black-line circles cases that finish in the second peak (1.7 < RP < 4 R⊕).
Current usage metrics show cumulative count of Article Views (full-text article views including HTML views, PDF and ePub downloads, according to the available data) and Abstracts Views on Vision4Press platform.
Data correspond to usage on the plateform after 2015. The current usage metrics is available 48-96 hours after online publication and is updated daily on week days.
Initial download of the metrics may take a while.