Fig. 7.
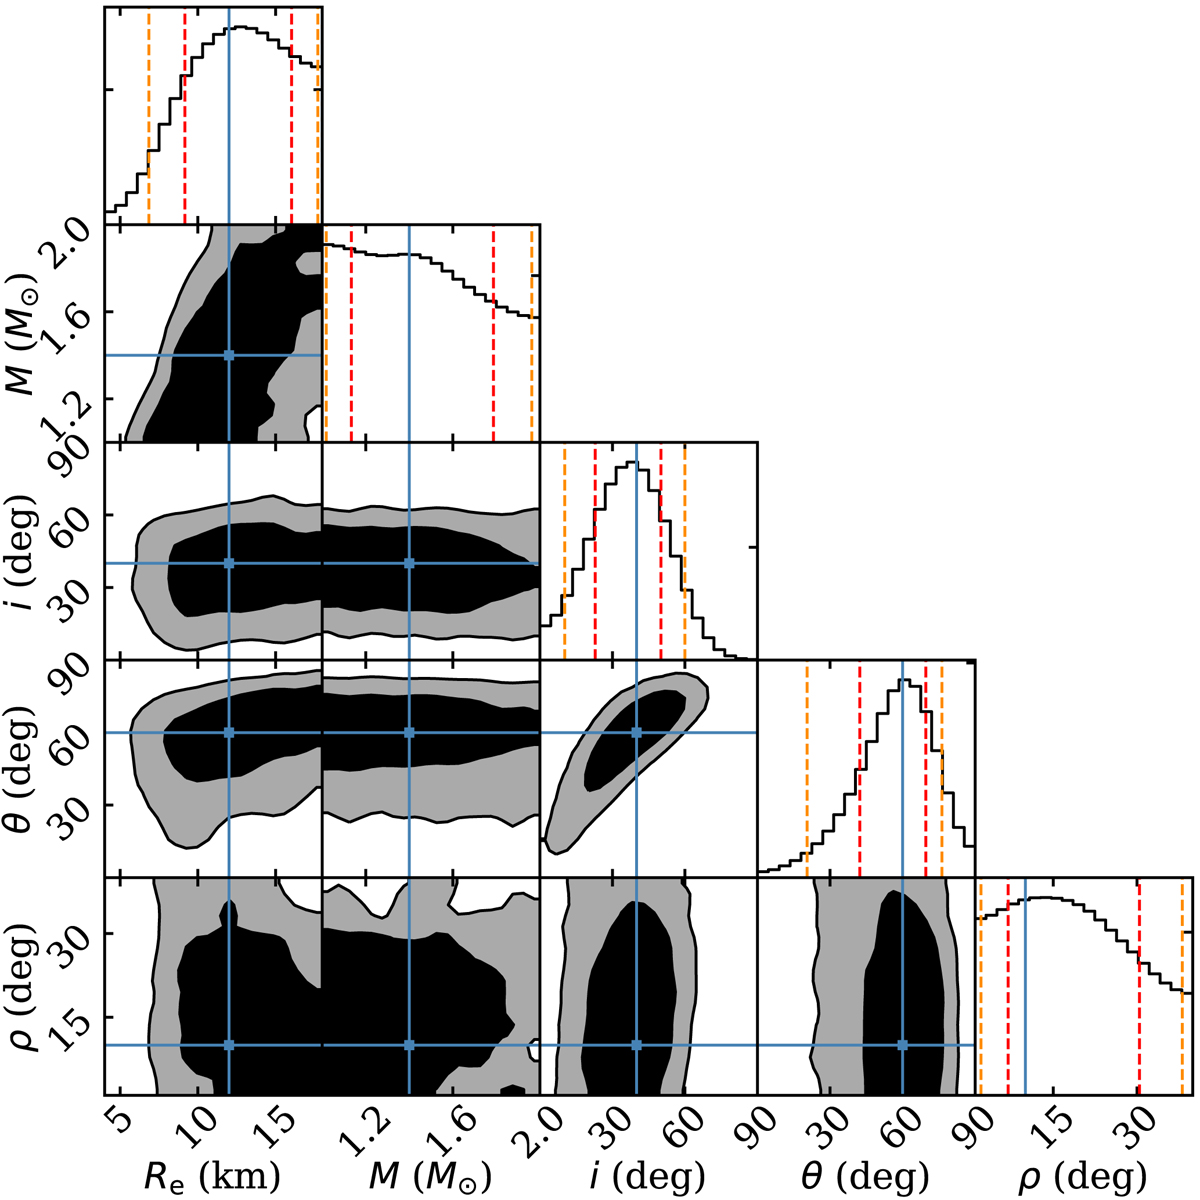
Posterior distributions for an oblate fit to an oblate star assuming 15° standard deviation in the measured PA. In the two-dimensional posterior distributions the 68% (in black) and the 95% (in gray) highest posterior density credible regions are shown. In the one-dimensional posterior distributions the dashed red contour shows a 68% and the dashed orange contour a 95% highest posterior density credible interval. The blue lines show the input values.
Current usage metrics show cumulative count of Article Views (full-text article views including HTML views, PDF and ePub downloads, according to the available data) and Abstracts Views on Vision4Press platform.
Data correspond to usage on the plateform after 2015. The current usage metrics is available 48-96 hours after online publication and is updated daily on week days.
Initial download of the metrics may take a while.