Open Access
Fig. 15
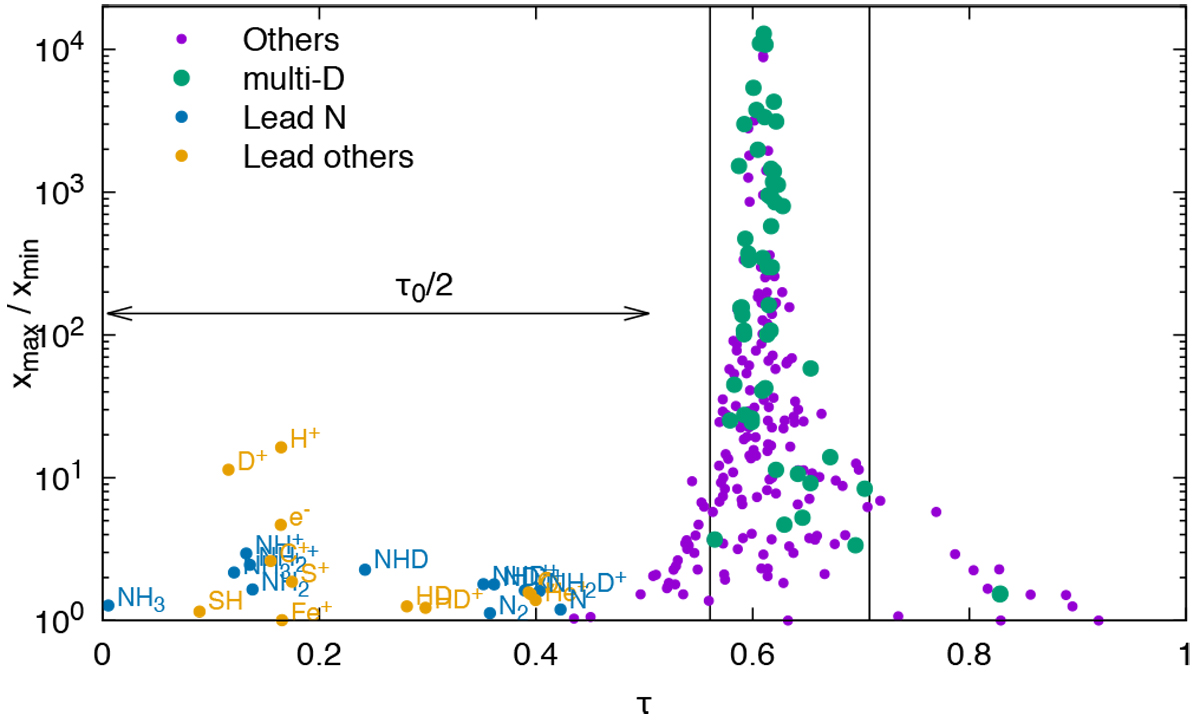
Ratio of maximum to minimum abundances as a function of phase shift with respect to NH3. “multi-D” are molecules with two or more D. The two vertical lines delineate the time range where multideuterated species peak.
Current usage metrics show cumulative count of Article Views (full-text article views including HTML views, PDF and ePub downloads, according to the available data) and Abstracts Views on Vision4Press platform.
Data correspond to usage on the plateform after 2015. The current usage metrics is available 48-96 hours after online publication and is updated daily on week days.
Initial download of the metrics may take a while.