Fig. 9.
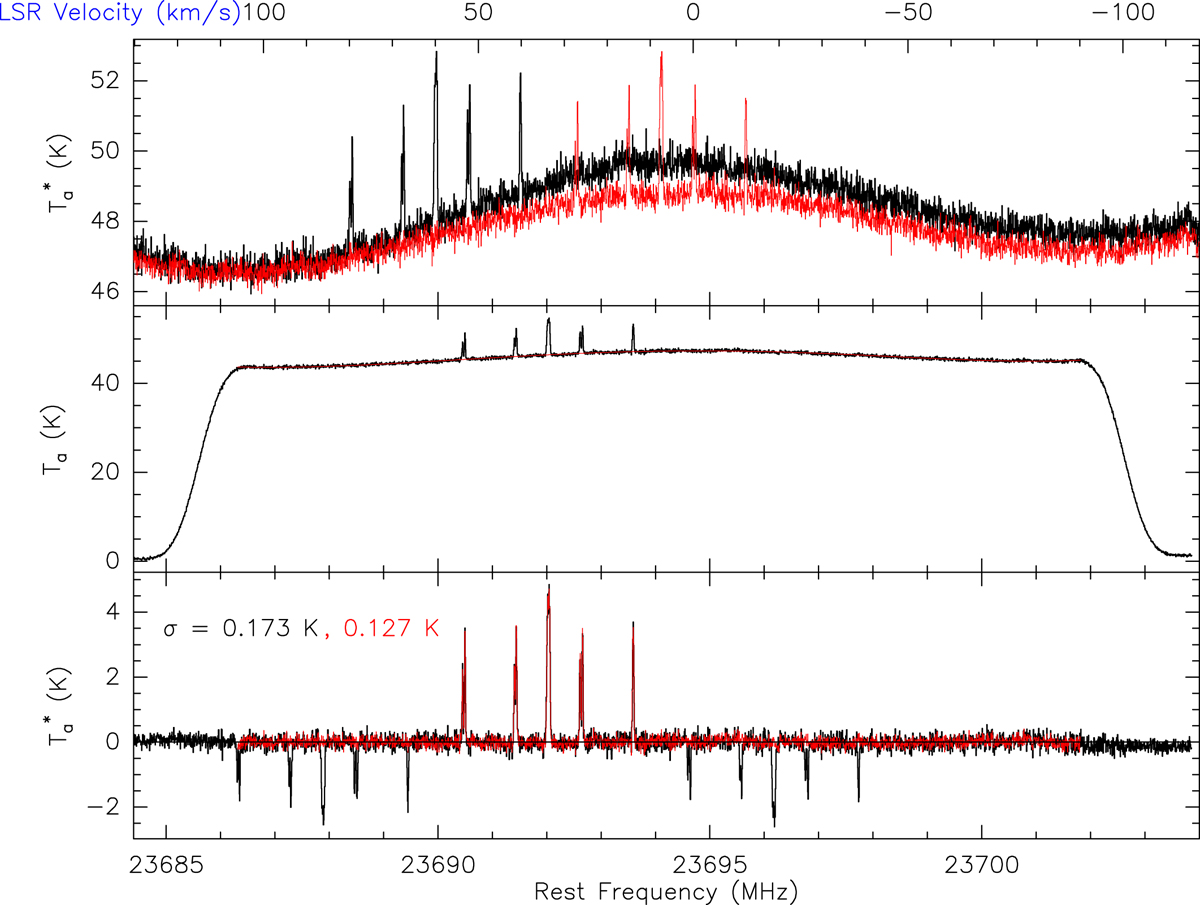
GBT NH3 observations with the VEGAS backend showing a comparison between TP mode and frequency SM. The top window shows the individual spectra at two different frequencies. The frequency axis is narrowed to mask the shoulders at both ends (seen in Fig. 8). The middle box displays the two spectra realigned and averaged (TP mode). Because of the frequency shift, both shoulders are brought back in the frequency range. A fifth degree polynomial is fitted in between them (red line). The bottom box shows the comparison between the standard frequency SM folded spectrum (black) and the TP mode spectrum (red, shoulders have been erased).
Current usage metrics show cumulative count of Article Views (full-text article views including HTML views, PDF and ePub downloads, according to the available data) and Abstracts Views on Vision4Press platform.
Data correspond to usage on the plateform after 2015. The current usage metrics is available 48-96 hours after online publication and is updated daily on week days.
Initial download of the metrics may take a while.