Fig. 7.
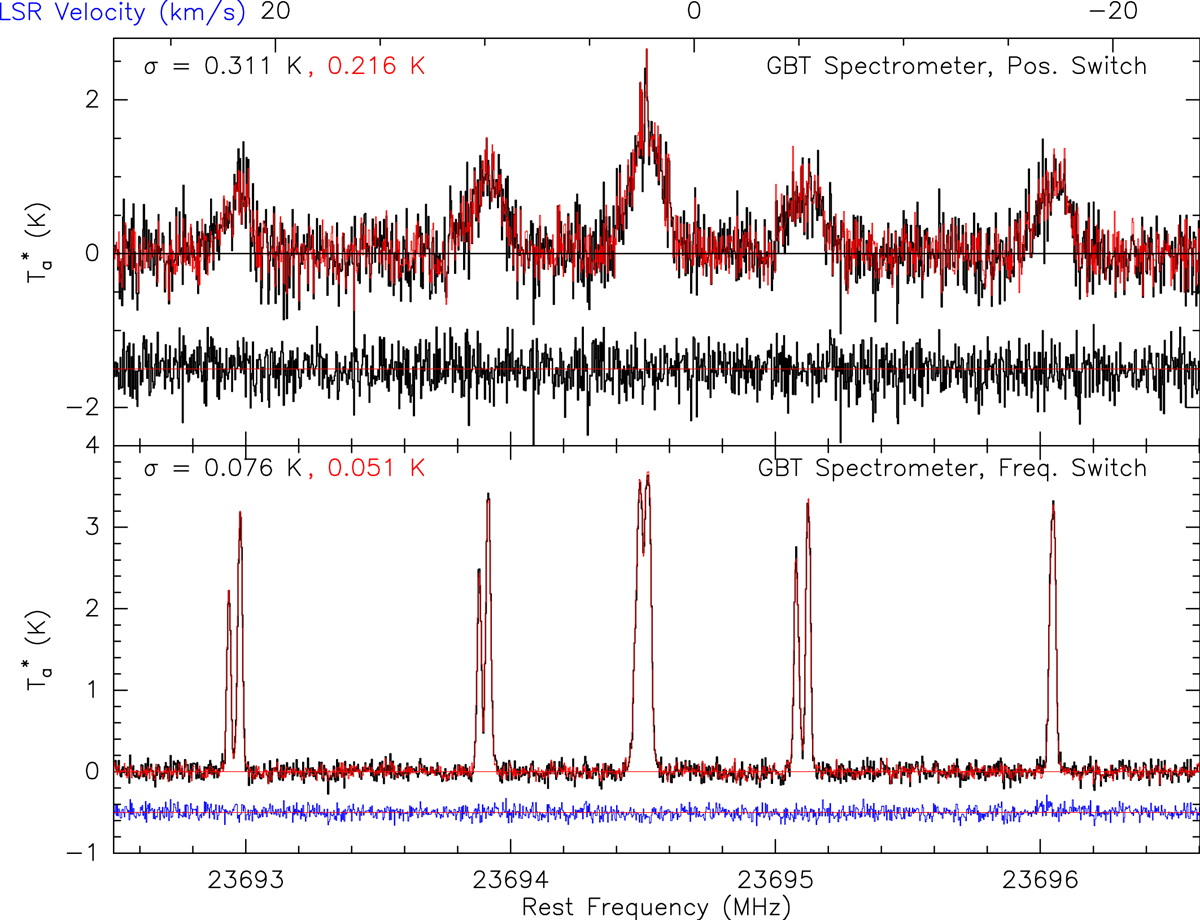
Comparison between standard reduction (position and frequency SM, black) with TP mode reduction (red) for NH3 observations with the old GBT spectrometer in two different sources. The spectrum shown at the top is identical to the one displayed in Fig. 6 but zoomed in on the lines. Noise improvement is close to ![]() . The difference between both reduction modes is displayed in blue and shifted by −0.5 K.
. The difference between both reduction modes is displayed in blue and shifted by −0.5 K.
Current usage metrics show cumulative count of Article Views (full-text article views including HTML views, PDF and ePub downloads, according to the available data) and Abstracts Views on Vision4Press platform.
Data correspond to usage on the plateform after 2015. The current usage metrics is available 48-96 hours after online publication and is updated daily on week days.
Initial download of the metrics may take a while.