Fig. 3.
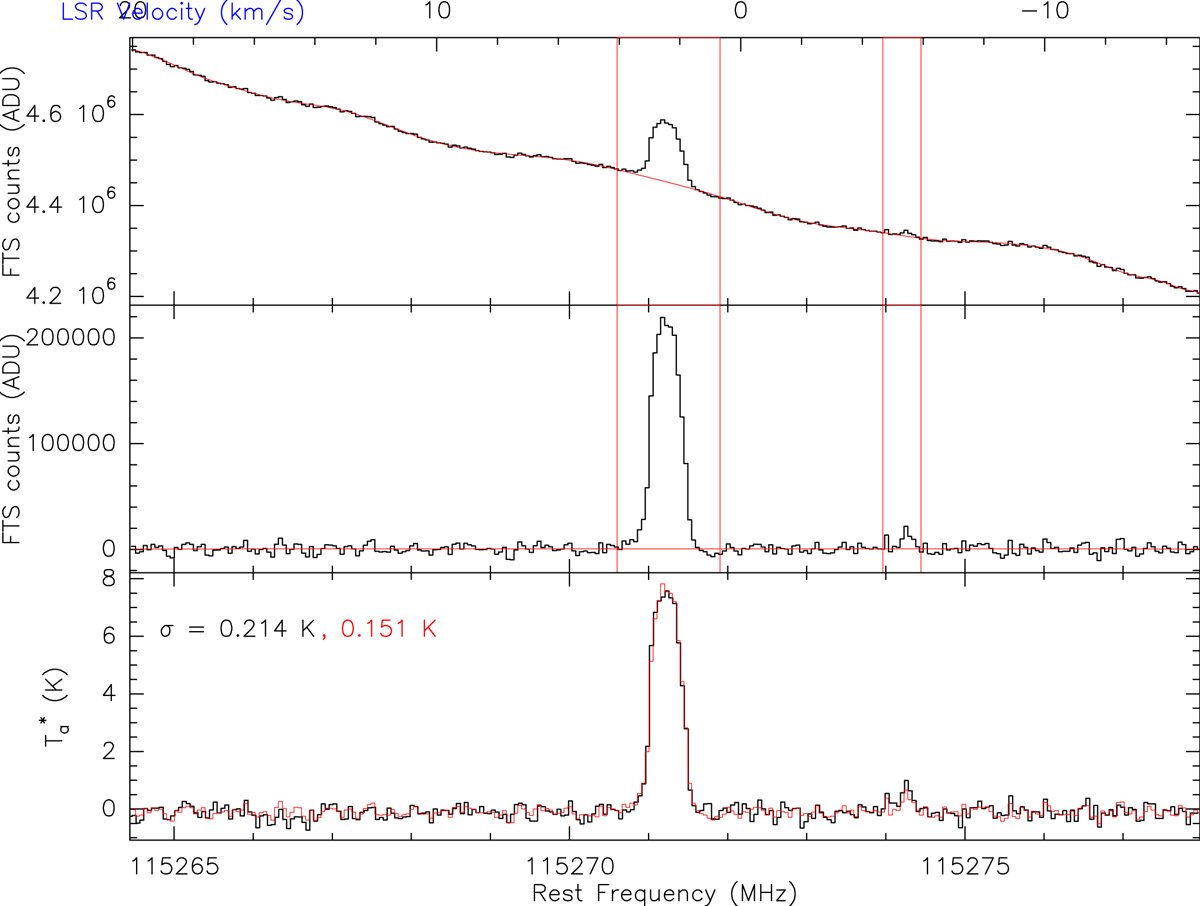
Same observations as in Fig. 1. Top: raw autocorrelator counts of the two phases re-aligned on top of each other and averaged together. A polynomial of 25th order is fitted (in red). Red vertical lines delimit the weak telluric and strong astrophysics 12CO lines. Middle: baseline-subtracted raw average. Bottom: comparison between the standard data reduction of the observations (black) and TP mode reduction of the data (red).
Current usage metrics show cumulative count of Article Views (full-text article views including HTML views, PDF and ePub downloads, according to the available data) and Abstracts Views on Vision4Press platform.
Data correspond to usage on the plateform after 2015. The current usage metrics is available 48-96 hours after online publication and is updated daily on week days.
Initial download of the metrics may take a while.