Open Access
Fig. 2.
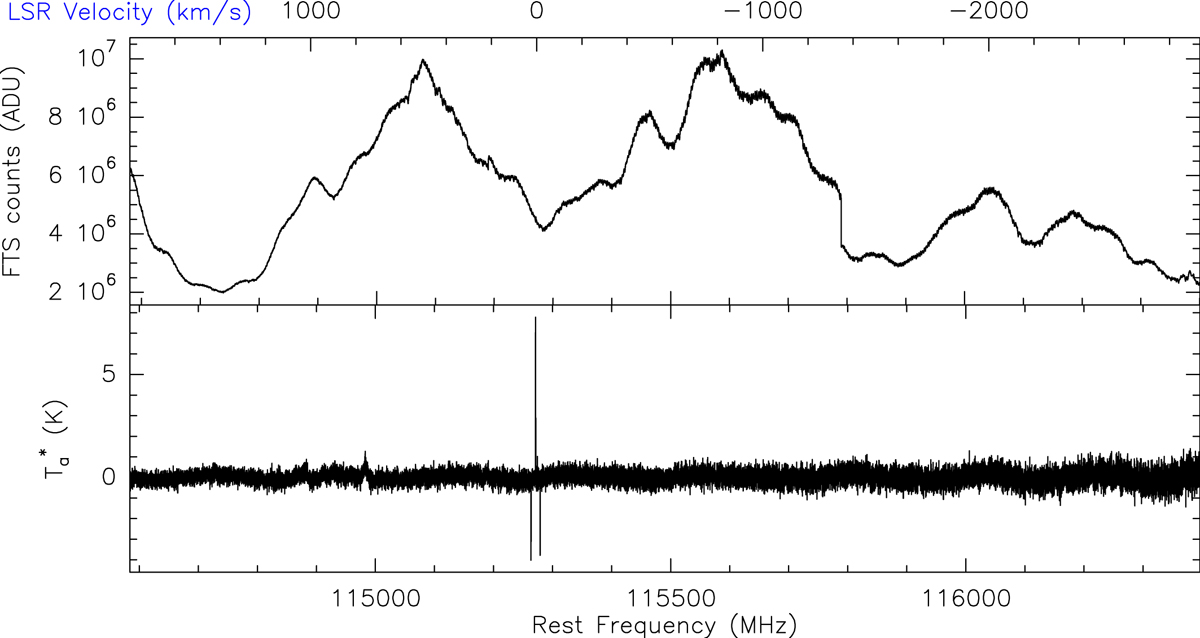
Same observations as in Fig. 1. Top: sky observation with the full band IRAM 30-m FTS backend (one setup, one polarization). Bottom: resulting folded frequency SM observation after one-minute integration. The strong positive peak with two negative half-intensity ones is the 12CO line displayed in the upper panel of Fig. 1.
Current usage metrics show cumulative count of Article Views (full-text article views including HTML views, PDF and ePub downloads, according to the available data) and Abstracts Views on Vision4Press platform.
Data correspond to usage on the plateform after 2015. The current usage metrics is available 48-96 hours after online publication and is updated daily on week days.
Initial download of the metrics may take a while.