Fig. 1.
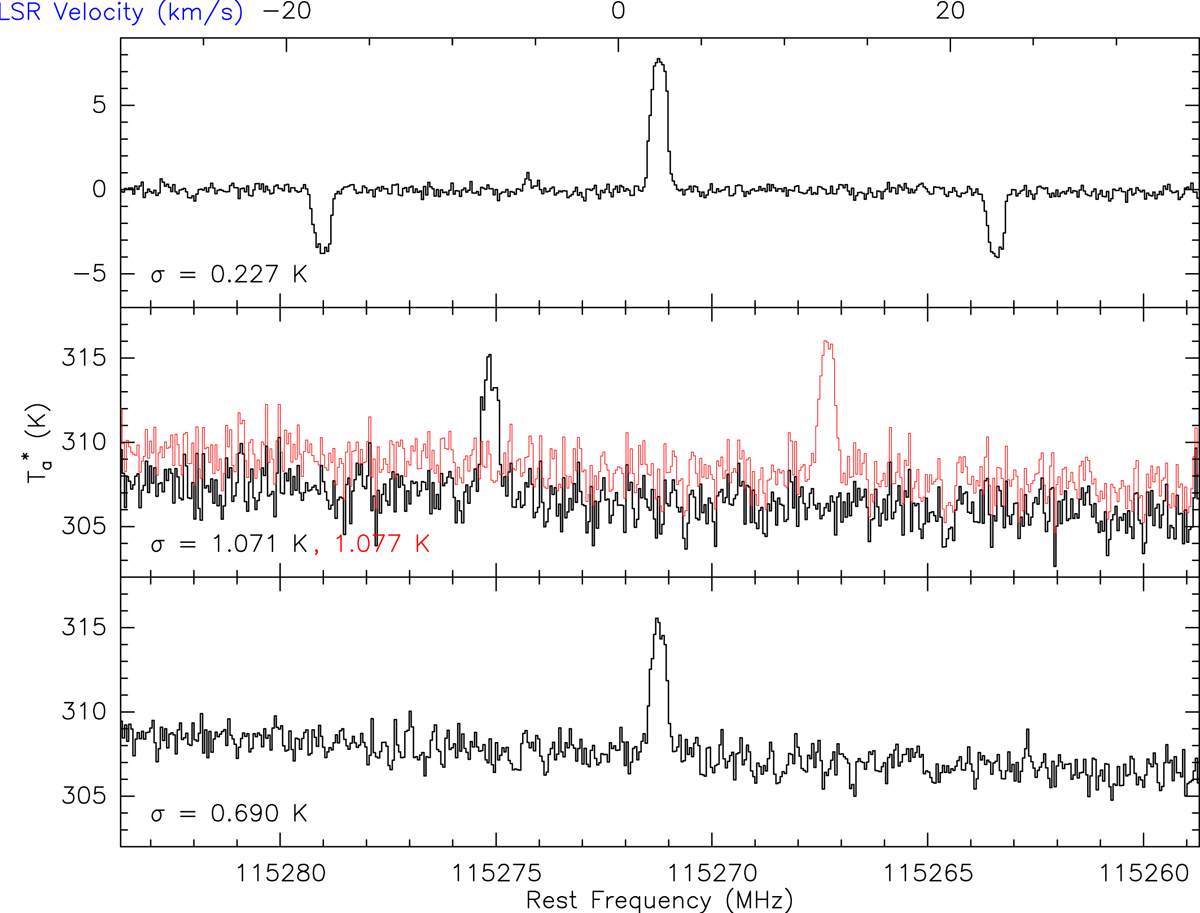
12CO (J:1–0) frequency SM observation obtained at the IRAM 30-m telescope with the EMIR receiver and FTS backend. Top: standard folded spectrum after subtraction and calibration. Middle: original two phases calibrated independently. Bottom: two phases directly averaged after realignment without using noise-averaged gain or subtracting a baseline from the raw data. The baseline shows no ripples but the noise is three times higher than in the upper panel. The vertical axis has the same amplitude for all three boxes (16 K). The color of the rms figure corresponds to the color of the spectra to which it pertains.
Current usage metrics show cumulative count of Article Views (full-text article views including HTML views, PDF and ePub downloads, according to the available data) and Abstracts Views on Vision4Press platform.
Data correspond to usage on the plateform after 2015. The current usage metrics is available 48-96 hours after online publication and is updated daily on week days.
Initial download of the metrics may take a while.