Fig. 6.
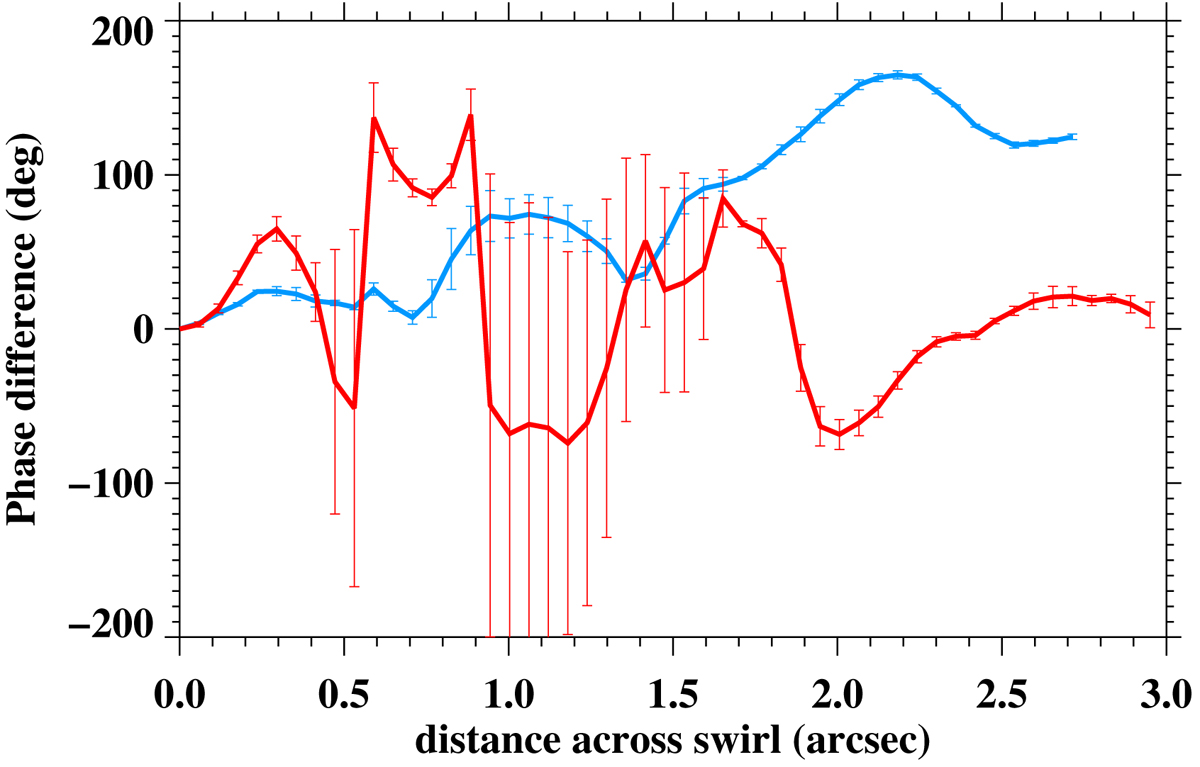
Average phase difference of FWHM oscillations around the dominant frequency of 4 mHz (±0.5 mHz) as a function of distance across the diameters of the swirls within the red (red curve) and cyan circle (cyan curve). The FWHM phase differences are derived relative to each swirl’s left edge that is used as a reference point, with the ends of both curves ideally associated with opposite sides of the waveguide in the case of torsional Alfvén perturbations. Only FWHM oscillations at selected time intervals when these swirls are clearly visible (see Fig. 2, panels g and h) have been considered for the phase differences derivation. Overplotted error bars correspond to the respective standard deviation of the FWHM oscillations within the considered frequency range.
Current usage metrics show cumulative count of Article Views (full-text article views including HTML views, PDF and ePub downloads, according to the available data) and Abstracts Views on Vision4Press platform.
Data correspond to usage on the plateform after 2015. The current usage metrics is available 48-96 hours after online publication and is updated daily on week days.
Initial download of the metrics may take a while.