Fig. 4.
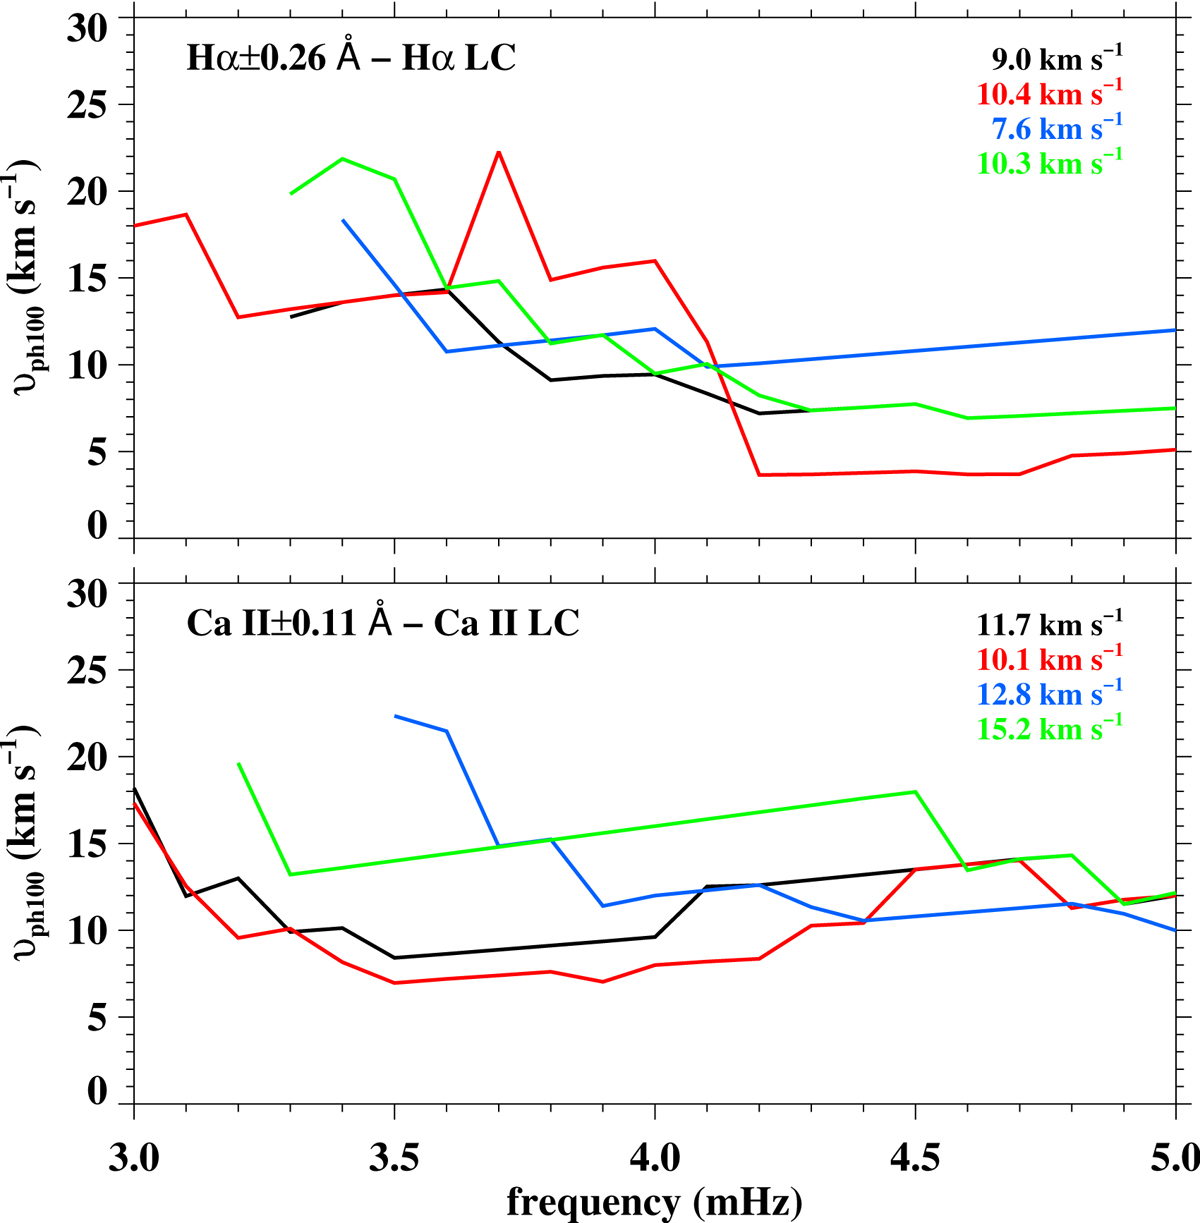
Phase speeds υph100 (in km s−1) for a height difference of 100 km derived from the phase difference corresponding to the maximum cross-power of the considered I–I pairs (white lines in Figs. 2 and 3) within the dominant frequency range and for different areas. Here, υph100 has been calculated only for phase differences higher than 10° within the vortex area (black curves), and the swirls within the red, cyan, and green circles (respective colour curves) shown in Fig. 1. Coloured legends provide the weighted mean υph100 values with the respective normalised cross-power as weight. The derivation of actual speeds, υph, further requires the actual formation height separation, dh, as they are equal to (dh/100 km) × υph100, according to Eq. (2).
Current usage metrics show cumulative count of Article Views (full-text article views including HTML views, PDF and ePub downloads, according to the available data) and Abstracts Views on Vision4Press platform.
Data correspond to usage on the plateform after 2015. The current usage metrics is available 48-96 hours after online publication and is updated daily on week days.
Initial download of the metrics may take a while.