Fig. 1.
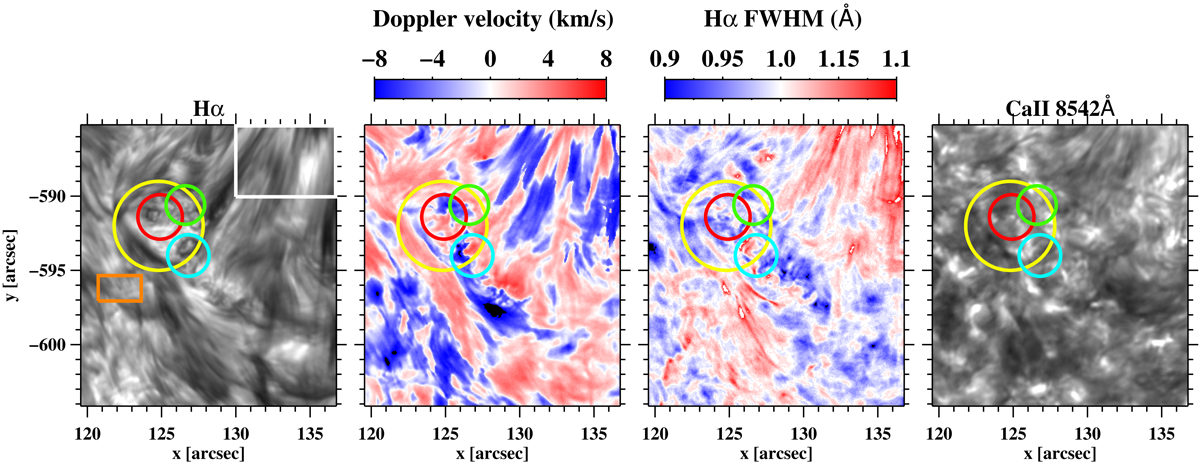
Snapshot of the ROI in Hα LC (first panel), Hα Doppler velocity (second panel), Hα FWHM (third panel), and the Ca II 8542 Å LC. In both intensity images, black indicates structures in absorption while the grayscaling in each panel is within ±3σ from the respective mean value of the whole image with σ corresponding to the respective standard deviation. The overplotted yellow circle indicates the location of the analysed conspicuous vortex flow, while smaller red, green, and cyan circles denote the approximate location of smaller swirls (substructure), extensively discussed in Papers I and II. The orange and white rectangles in the Hα LC panel show, respectively, the selected QSR and FSR (see text).
Current usage metrics show cumulative count of Article Views (full-text article views including HTML views, PDF and ePub downloads, according to the available data) and Abstracts Views on Vision4Press platform.
Data correspond to usage on the plateform after 2015. The current usage metrics is available 48-96 hours after online publication and is updated daily on week days.
Initial download of the metrics may take a while.