Fig. 9.
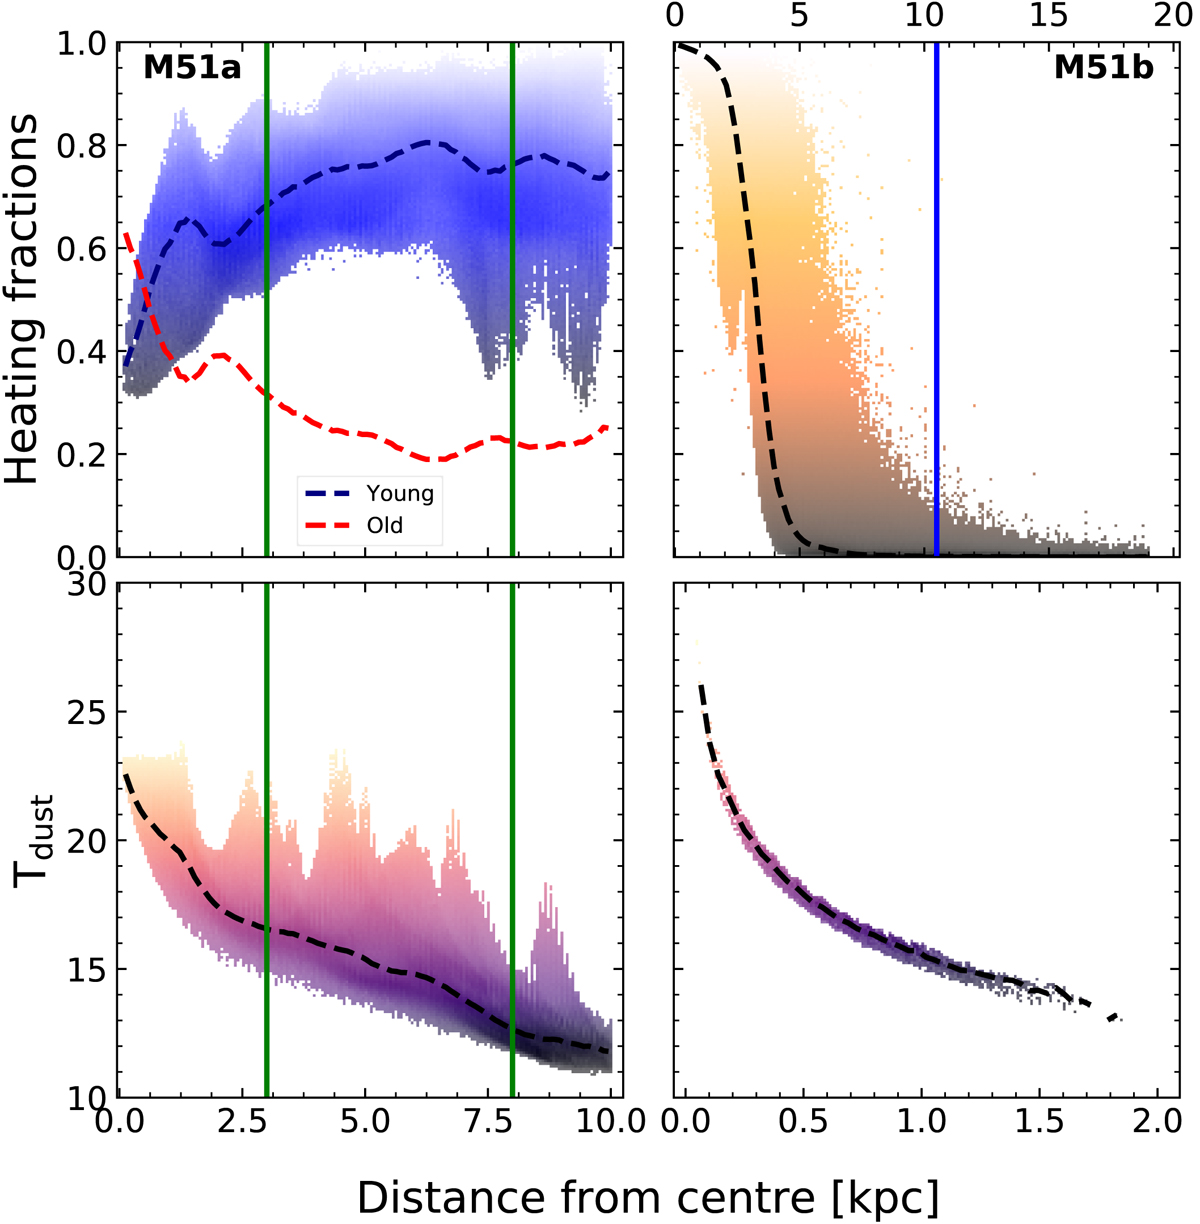
Various radial profiles of M 51 obtained from the 3D dust cell data. First column, from top to bottom: radial profiles of the dust heating fractions and the dust temperature for M 51a. The vertical green lines indicate the 3 kpc and 8 kpc radii. Second column, top: radial profile of fM 51b up to 20 kpc radii from the centre of M 51b; the blue line gives the location of the central region of M 51a. Second column, bottom: radial profile of the dust temperature of M 51b up to a radius of 2 kpc radii; the dashed lines passing though the points represent the running median. The points are colour-coded according to the same quantity as in the y-axis. The level of transparency indicates the point density.
Current usage metrics show cumulative count of Article Views (full-text article views including HTML views, PDF and ePub downloads, according to the available data) and Abstracts Views on Vision4Press platform.
Data correspond to usage on the plateform after 2015. The current usage metrics is available 48-96 hours after online publication and is updated daily on week days.
Initial download of the metrics may take a while.