Fig. 8.
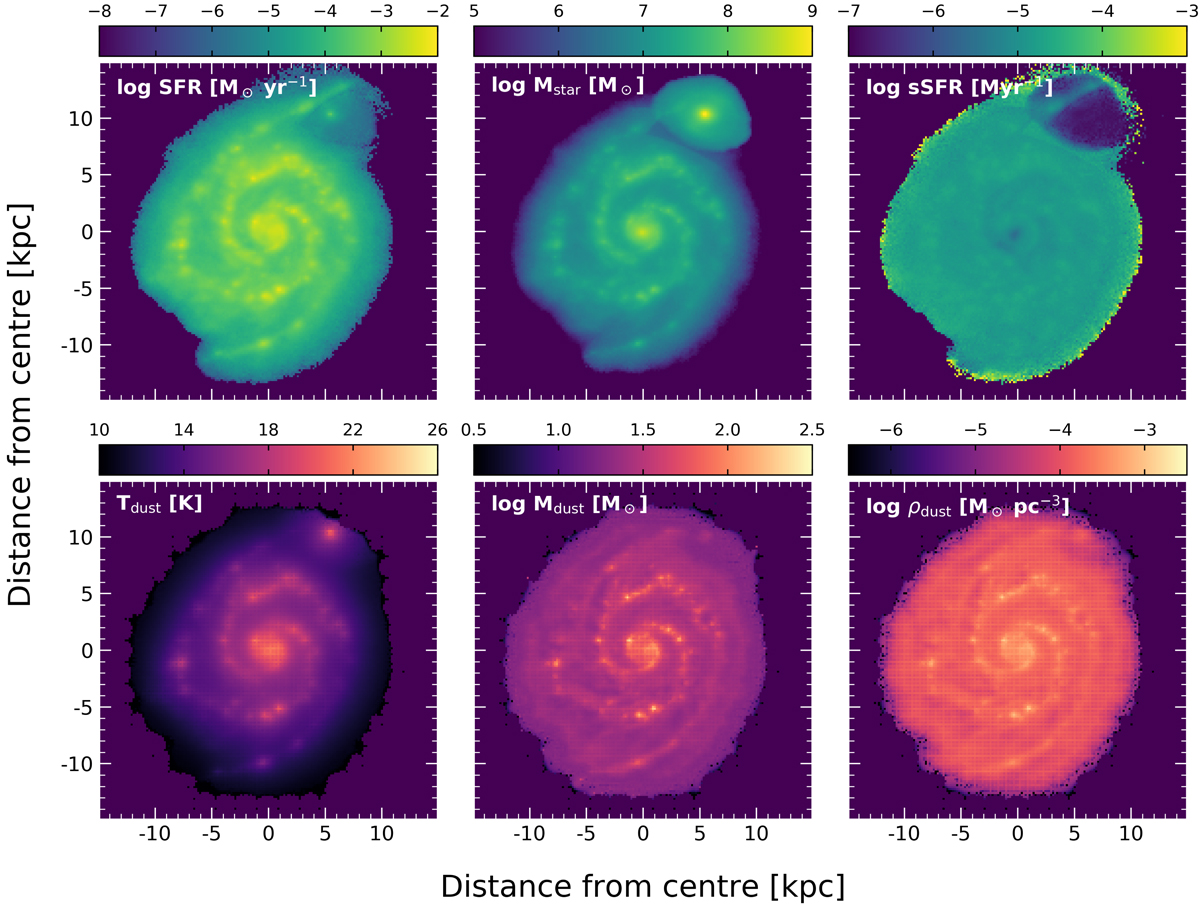
Various physical maps of a face-on view of M 51. Top row, from left to right: SFR, stellar mass, and specific star formation rate spatial maps. Bottom row, from left to right: dust temperature, dust mass, and dust density spatial maps. All maps, except the dust temperature map, are in log-scale. All maps share the same pixel scale as the PACS 160 μm image: 4.0″.
Current usage metrics show cumulative count of Article Views (full-text article views including HTML views, PDF and ePub downloads, according to the available data) and Abstracts Views on Vision4Press platform.
Data correspond to usage on the plateform after 2015. The current usage metrics is available 48-96 hours after online publication and is updated daily on week days.
Initial download of the metrics may take a while.