Fig. 11.
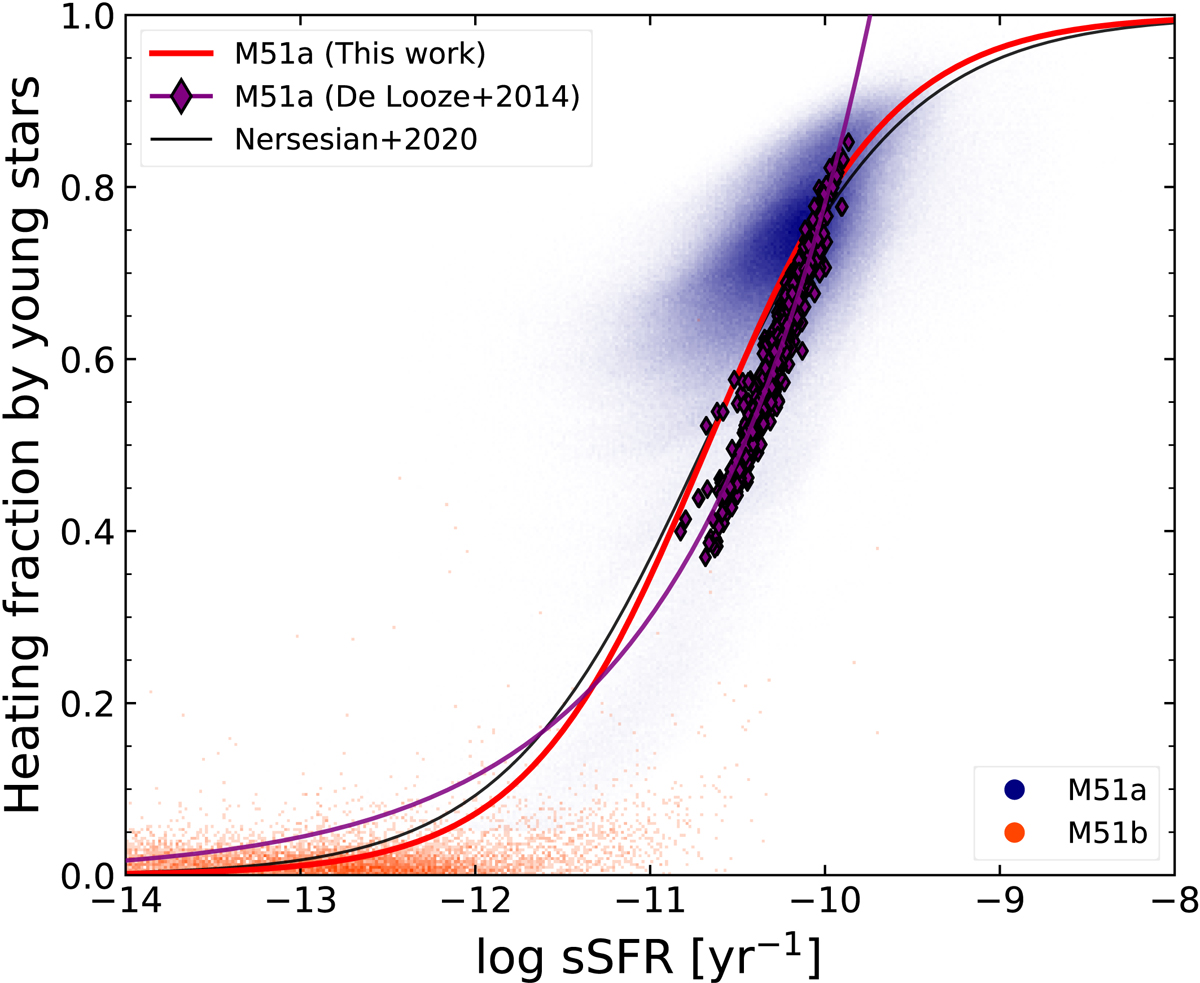
Relation between sSFR and fyoung. The blue points represent the dust cells that belong to M 51a within a 10 kpc radius of its centre, and the orange points the dust cells of M 51b. The level of transparency indicates the points density. The red line is the fit through the points of M 51a with Eq. (7). The purple diamonds are the pixel values of M 51a, and the purple line is the power-law fit to that data from the model of De Looze et al. (2014). The black line shows the MS of galaxies as derived in Nersesian et al. (2020) by fitting the voxels of the radiative transfer models of six face-on late-type galaxies.
Current usage metrics show cumulative count of Article Views (full-text article views including HTML views, PDF and ePub downloads, according to the available data) and Abstracts Views on Vision4Press platform.
Data correspond to usage on the plateform after 2015. The current usage metrics is available 48-96 hours after online publication and is updated daily on week days.
Initial download of the metrics may take a while.