Fig. 10.
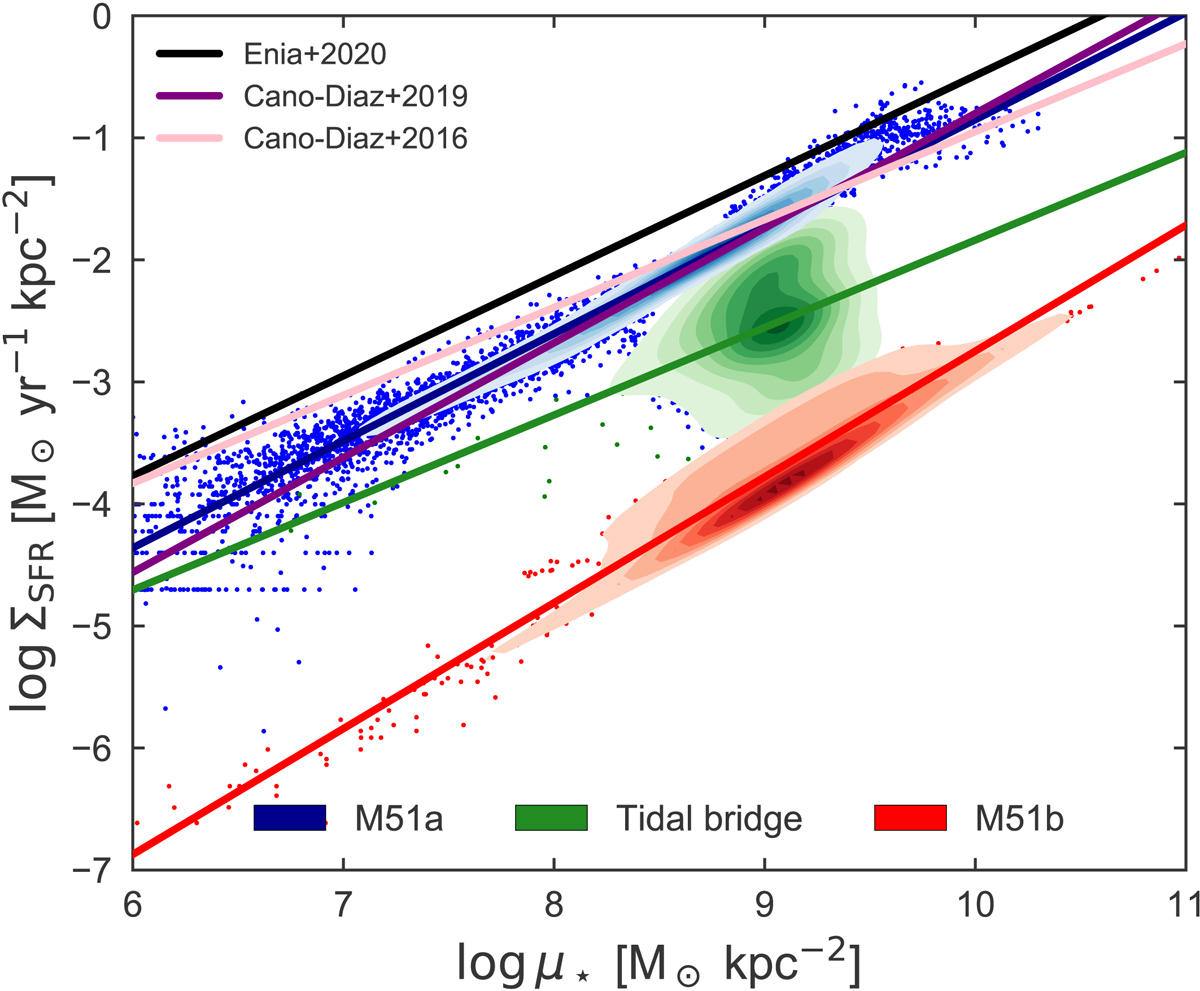
ΣSFR against stellar mass density for M 51 (physical scale of 153.4 pc). The blue density distribution represents the pixels that belong to M 51a, the green distribution corresponds to the pixels of the tidal bridge, and the red distribution denotes the pixels of M 51b within a 2 kpc radius. The black line is the relation presented in Enia et al. (2020), the purple line is the best-fitting relation from MaNGA (Cano-Díaz et al. 2019), and the pink line is for galaxies in the CALIFA survey (Cano-Díaz et al. 2016). The remaining coloured lines are a fit through the distribution of the same colour.
Current usage metrics show cumulative count of Article Views (full-text article views including HTML views, PDF and ePub downloads, according to the available data) and Abstracts Views on Vision4Press platform.
Data correspond to usage on the plateform after 2015. The current usage metrics is available 48-96 hours after online publication and is updated daily on week days.
Initial download of the metrics may take a while.