Fig. 5
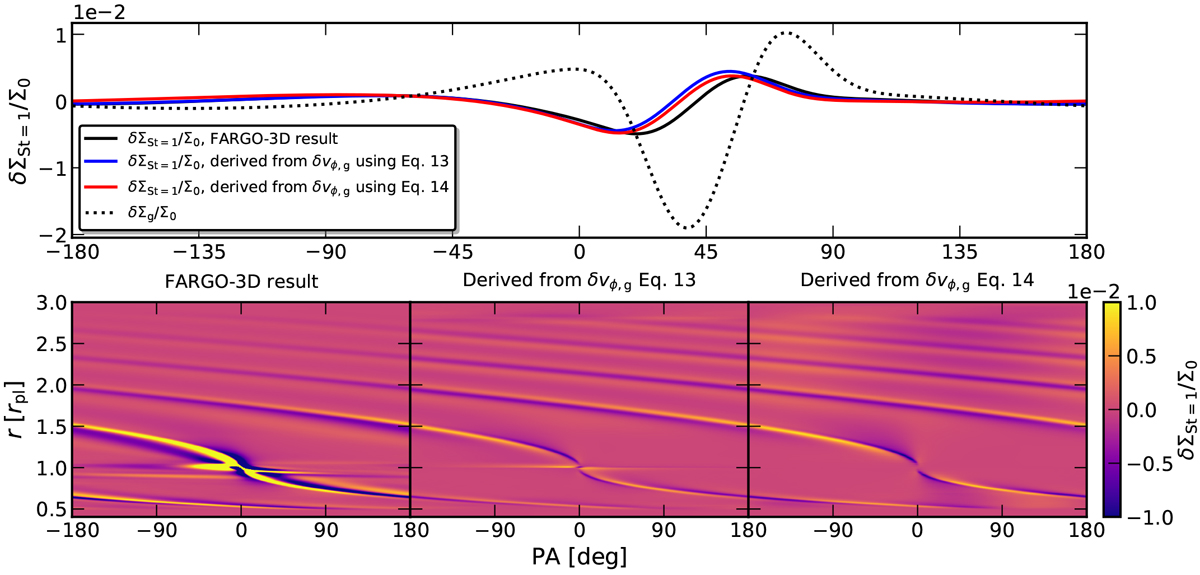
Top: azimuthal slice through the normalized density perturbation at a radius of 1.7rpl for the dust component with St = 1. The black line shows the time integrated FARGO-3D results, the blue line shows the results directly derived from the perturbation in azimuthal velocity of the gas using the perturbed continuity equation (Eq. (13)), the red line shows the result directly derived from the perturbation in the azimuthal velocity of the gas using a direct scaling between δvr and δΣ and the pitch angle of the spiral (Eq. (14)). The dotted line illustrates the density profile of the gas component for comparison. Bottom: normalized density perturbation in polar coordinates of the result for the St = 1 component. From left to right: time integrated FARGO-3D result, the results directly derived from the perturbation in the azimuthal velocity of the gas, and the result directly derived from the perturbation in azimuthal velocity of the gas, using a direct scaling between δvr and δΣ and the pitch angle of the spiral (Eq. (14)).
Current usage metrics show cumulative count of Article Views (full-text article views including HTML views, PDF and ePub downloads, according to the available data) and Abstracts Views on Vision4Press platform.
Data correspond to usage on the plateform after 2015. The current usage metrics is available 48-96 hours after online publication and is updated daily on week days.
Initial download of the metrics may take a while.