Free Access
Fig. 3
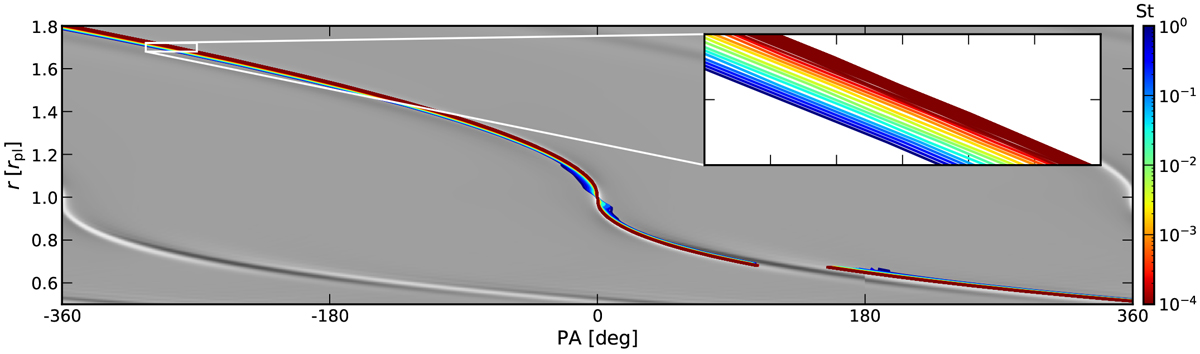
Polar plot of the perturbation in surface density over two orbits. The lines indicate the position of the maximum of the different dust components with a zoom of the region around r = 1.7 rpl that is used to determine the change in pitch angle.
Current usage metrics show cumulative count of Article Views (full-text article views including HTML views, PDF and ePub downloads, according to the available data) and Abstracts Views on Vision4Press platform.
Data correspond to usage on the plateform after 2015. The current usage metrics is available 48-96 hours after online publication and is updated daily on week days.
Initial download of the metrics may take a while.