Free Access
Fig. 5.
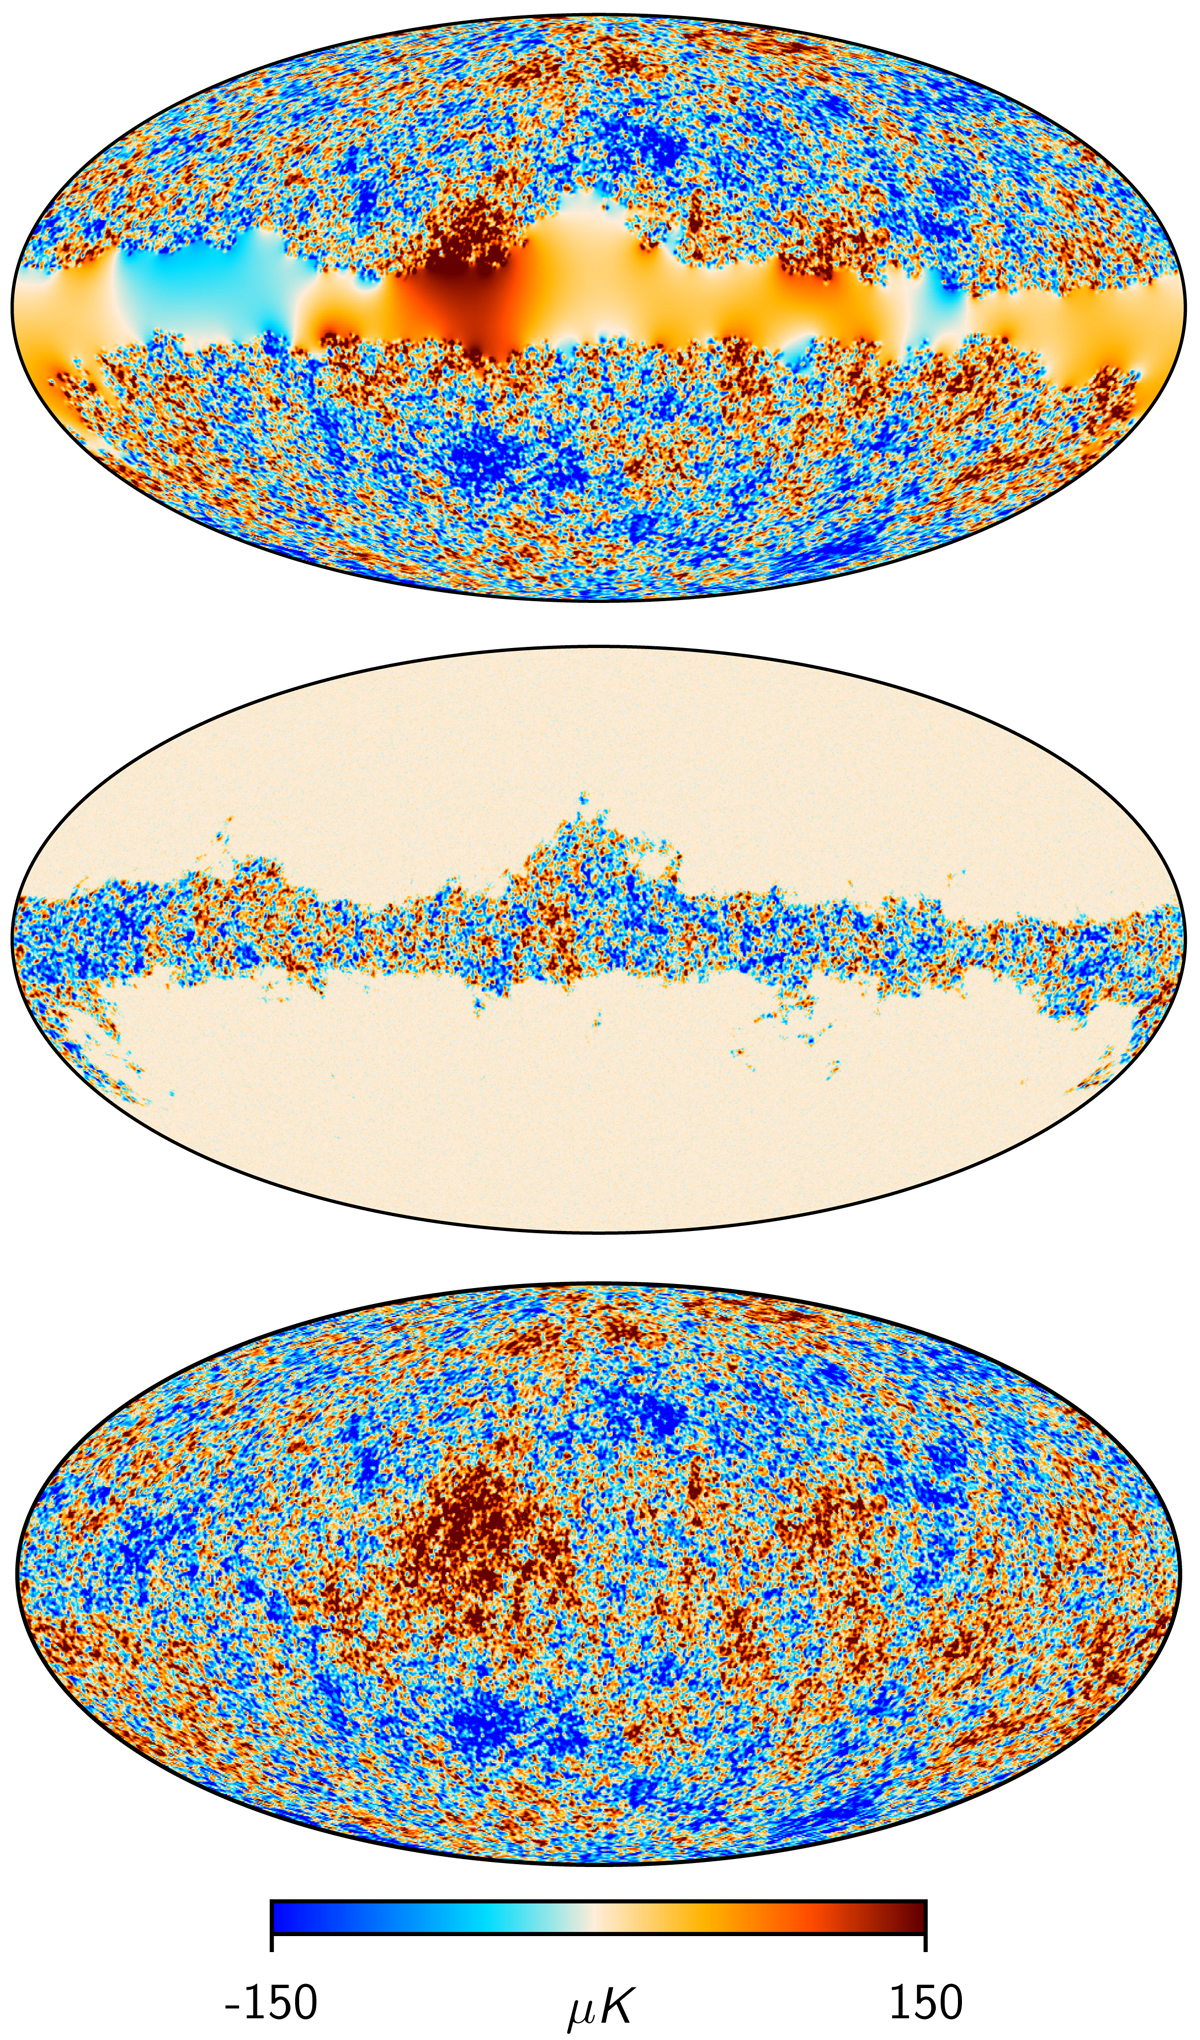
Illustration of the Gibbs sampling procedure. The full sample s (bottom panel) is the sum of the mean field map ![]() (top panel) and a fluctuation map
(top panel) and a fluctuation map ![]() (middle panel).
(middle panel).
Current usage metrics show cumulative count of Article Views (full-text article views including HTML views, PDF and ePub downloads, according to the available data) and Abstracts Views on Vision4Press platform.
Data correspond to usage on the plateform after 2015. The current usage metrics is available 48-96 hours after online publication and is updated daily on week days.
Initial download of the metrics may take a while.