Fig. 4.
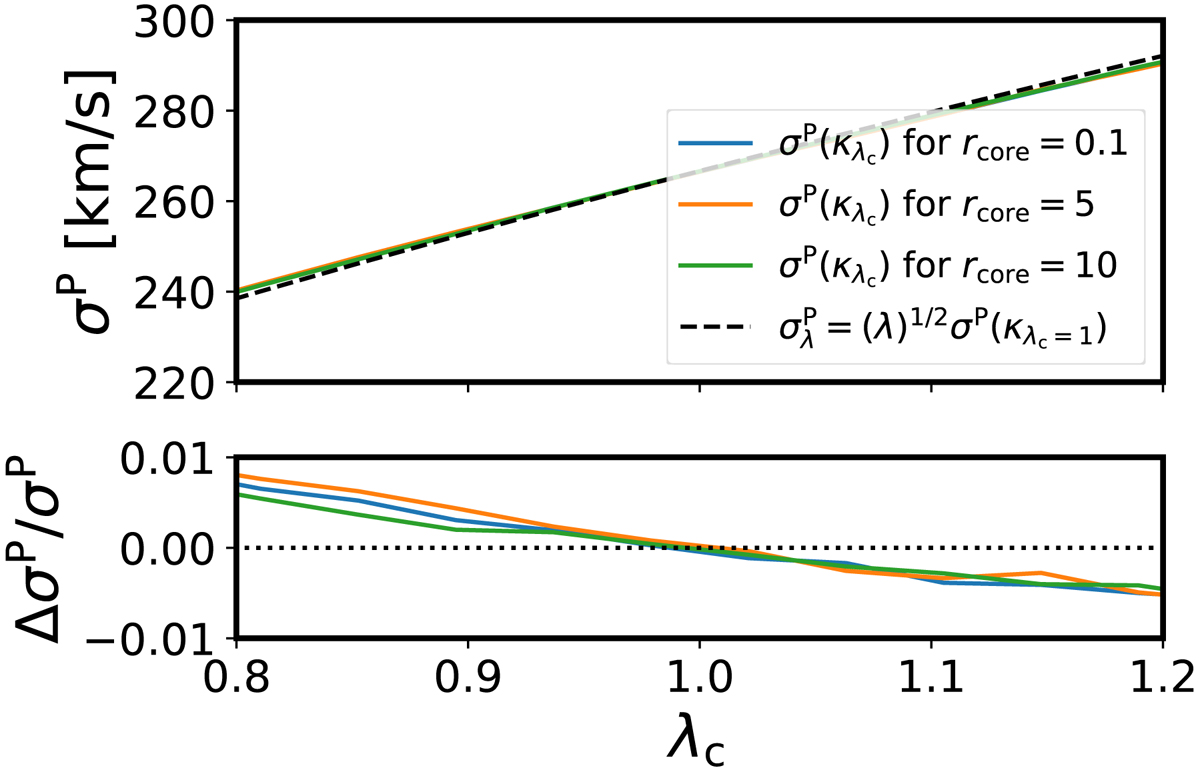
Comparison of the actual predicted kinematics from the modeling of the physical three-dimensional mass distribution κλint (Eq. (35)) for varying core sizes (solid) and the analytic relation of a perfect MST (Eq. (25), dashed) for the mock lens presented in Fig. A.2. Lower panel: fractional differences between the exact prediction and a perfect MST calculation. The MST prediction matches to < 1% in the considered range. Minor numerical noise is present at the subpercent level (https://github.com/TDCOSMO/hierarchy_analysis_2020_public/blob/6c293af582c398a5c9de60a51cb0c44432a3c598/MST_impact/MST_pl_cored.ipynb).
Current usage metrics show cumulative count of Article Views (full-text article views including HTML views, PDF and ePub downloads, according to the available data) and Abstracts Views on Vision4Press platform.
Data correspond to usage on the plateform after 2015. The current usage metrics is available 48-96 hours after online publication and is updated daily on week days.
Initial download of the metrics may take a while.