Fig. 3.
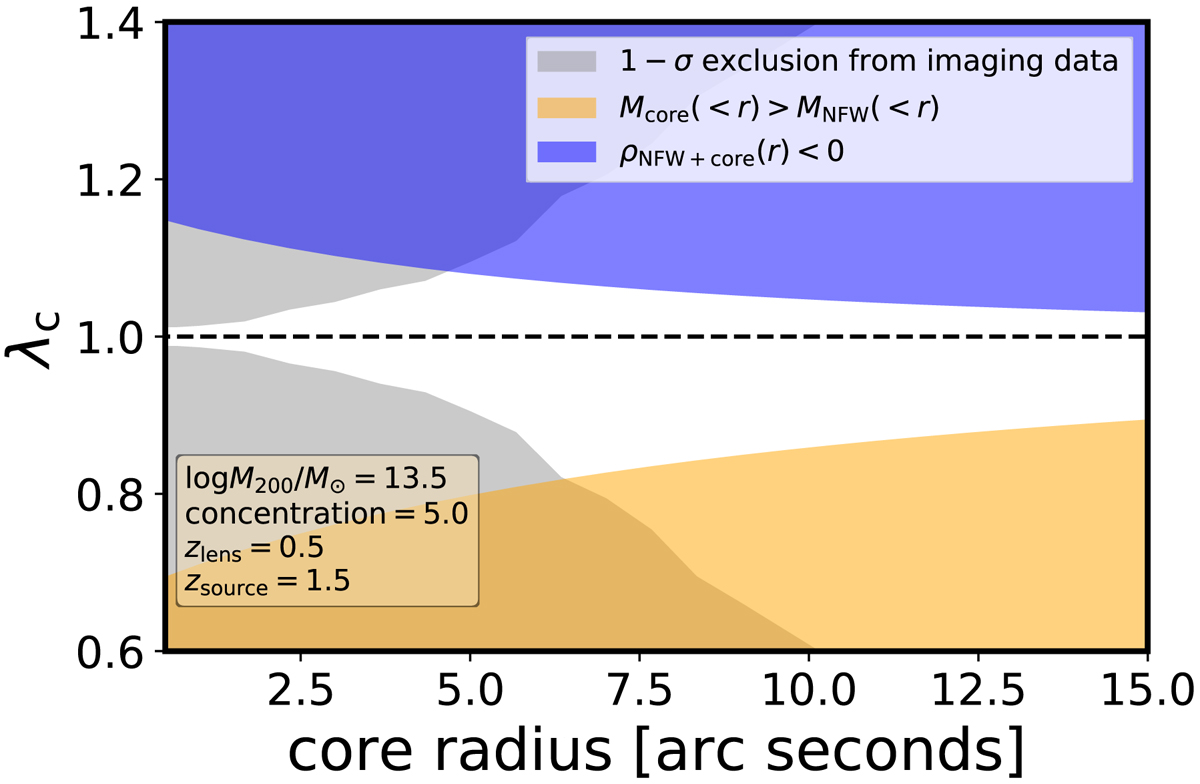
Constraints on an approximate internal MST transform with a cored component, λc, of an NFW profile as a function of core radius. In gray are the 1-σ exclusion limits that imaging data can provide. In orange is the region where the total mass of the core within a three-dimensional radius exceeds the mass of the NFW profile in the same sphere. In blue is the region where the transformed profile results in negative convergence at the core radius. The white region is effectively allowed by the imaging data and simple plausibility considerations and where we can use the mathematical MST as an approximation (λc ≈ λint). The halo mass, concentration and the redshift configuration is displayed in the lower left box (https://github.com/TDCOSMO/hierarchy_analysis_2020_public/blob/6c293af582c398a5c9de60a51cb0c44432a3c598/MST_impact/MST_pl_cored.ipynb).
Current usage metrics show cumulative count of Article Views (full-text article views including HTML views, PDF and ePub downloads, according to the available data) and Abstracts Views on Vision4Press platform.
Data correspond to usage on the plateform after 2015. The current usage metrics is available 48-96 hours after online publication and is updated daily on week days.
Initial download of the metrics may take a while.