Fig. 18.
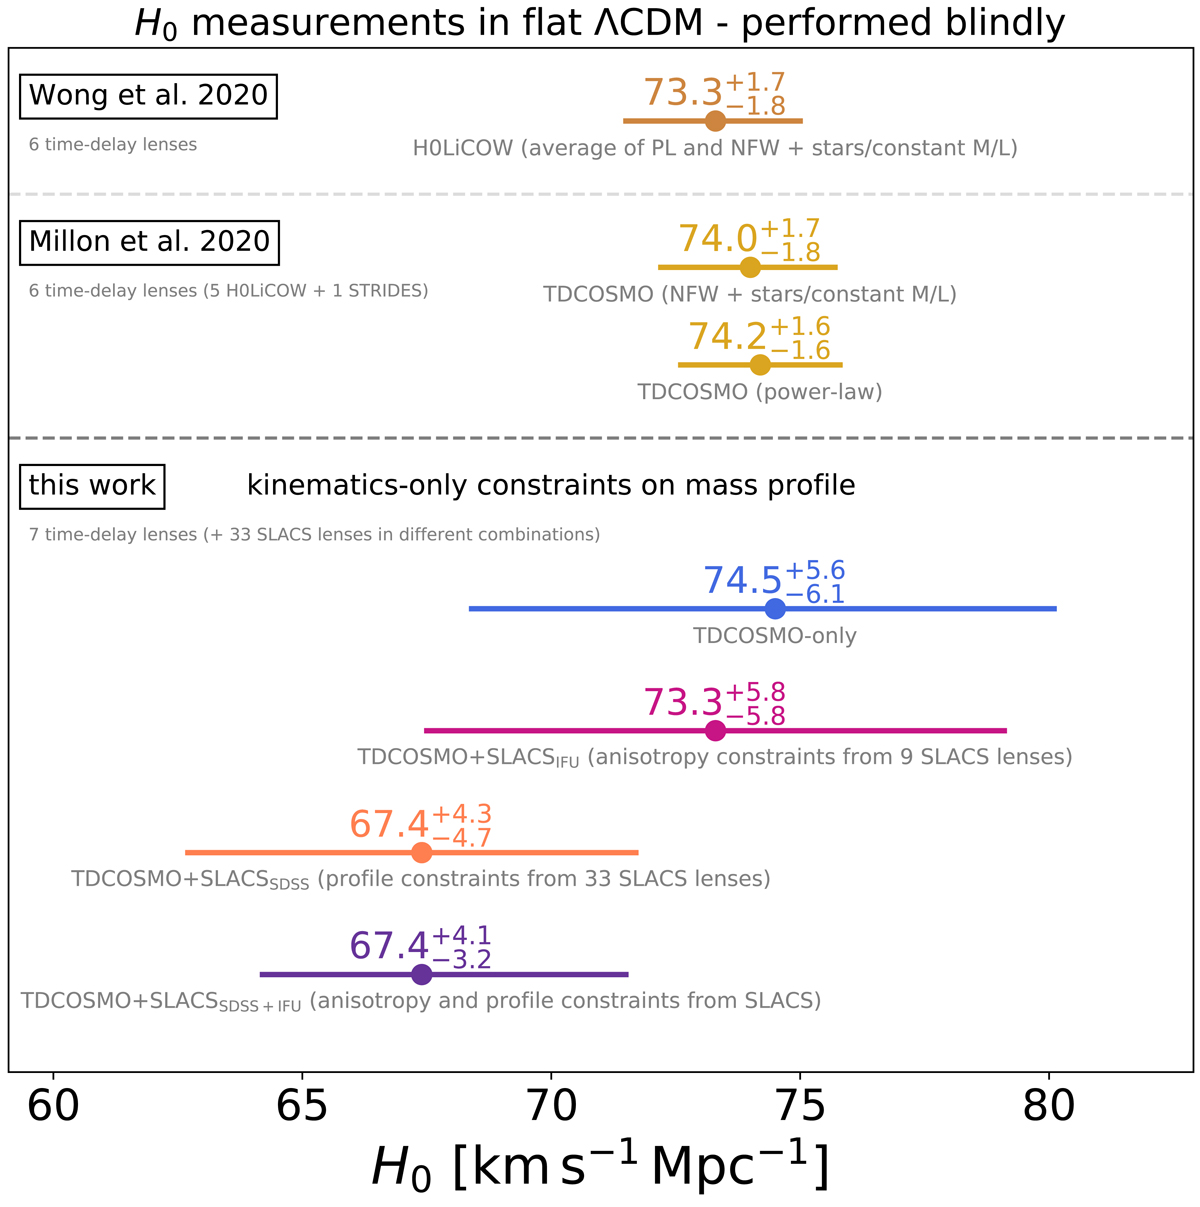
Comparison of different blind H0 measurements by the TDCOSMO collaboration, based on different mass profile assumptions and data sets incorporated. All measurements presented on this plot were performed blindly with regard to the inference of H0. The measurement on top is the combined H0LiCOW six lenses constraints presented by Wong et al. (2020), when averaging power-law and composite NFW plus stars (with constant mass-to-light ratio) on a lens-by-lens basis without correlated errors among the lenses. The next two measurements are from Millon et al. (2020) of six TDCOSMO time-delay lenses (five H0LiCOW lenses22 and one STRIDES lens by Shajib et al. 2020a), when performing the inference assuming either a composite NFW plus stars (with constant mass-to-light ratio) or the power-law mass density profile for the galaxy acting as a lens. Lower panel: results from this work. The main difference with respect to previous work is that we have made virtually no assumption on the radial mass density profile of the lens galaxy, and taken into account the covariance between the lenses. The analysis in this work is constrained only by the stellar kinematics and fully accounts for the uncertainty related to the mass sheet transformation (MST). In this framework, we obtain four measurements according to the datasets considered. The TDCOSMO-only inference is based on the same set of seven lenses as those jointly included by Millon et al. (2020) and Wong et al. (2020). The inferred median value is the same, indicating no bias, and the uncertainties, as expected, are larger. The next three measurements rely on external datasets from the SLACS survey, by making the assumption that the lens galaxies in the two surveys are drawn from the same population. The TDCOSMO+SLACSIFU measurements uses, in addition to the TDCOSMO sample, nine lenses from the SLACS sample with IFU observations to inform the anisotropy prior applied on the TDCOSMO lenses. The TDCOSMO+SLACSSDSS measurement comes from the joint analysis of the TDCOSMO sample and 33 SLACS lenses with SDSS spectroscopy. The TDCOSMO+SLACSSDSS + IFU presents the joint analysis of all three data sets, again assuming self-similar distributions of the mass profiles and stellar anisotropy. The TDCOSMO-only and TDCOSMO+SLACSIFU analyses do not rely on self-similar mass profiles of the SLACS and TDCOSMO sample while the TDCOSMO+SLACSSDSS and TDCOSMO+SLACSSDSS + IFU measurements (orange and purple) do. All the measurements shown in this plot are in statistical agreement with each other. See Sect. 8.5 for a discussion and physical interpretation of the results (https://github.com/TDCOSMO/hierarchy_analysis_2020_public/blob/6c293af582c398a5c9de60a51cb0c44432a3c598/JointAnalysis/tdcosmo_comparison_plot.ipynb).
Current usage metrics show cumulative count of Article Views (full-text article views including HTML views, PDF and ePub downloads, according to the available data) and Abstracts Views on Vision4Press platform.
Data correspond to usage on the plateform after 2015. The current usage metrics is available 48-96 hours after online publication and is updated daily on week days.
Initial download of the metrics may take a while.