Fig. 13.
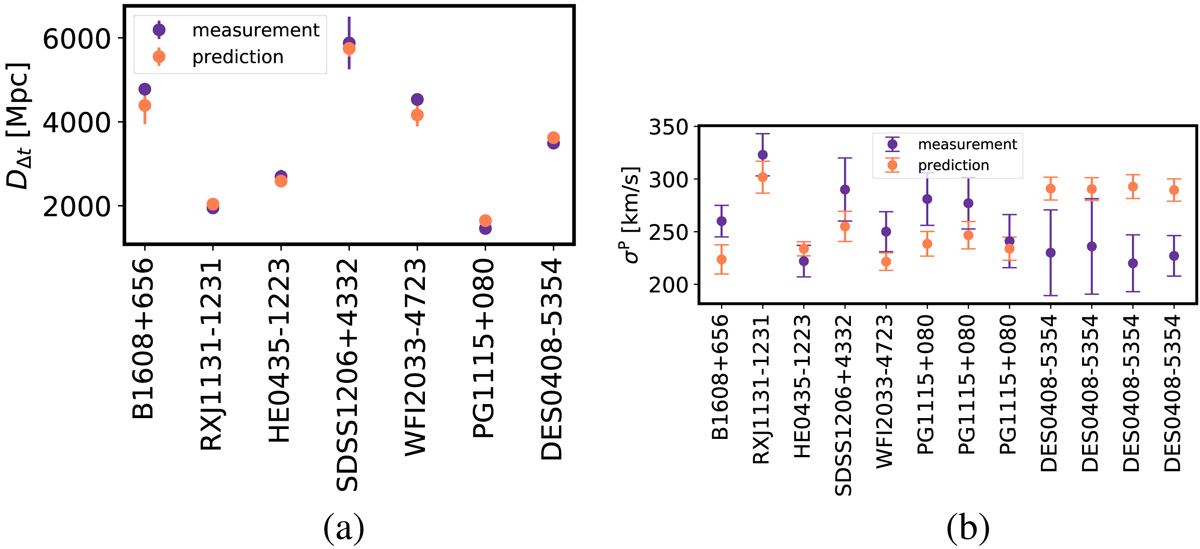
Illustration of the goodness of the fit of the maximum likelihood model of the joint analysis in describing the TDCOSMO data set. Blue points are the measurements with the diagonal elements of the measurement covariance matrix. Orange points are the model predictions with the diagonal elements of the model covariance uncertainties. Left: comparison of measured time-delay distance from imaging data and time delays compared with the predicted value from the cosmological model, the internal and external MST (and their distributions). Right: comparison of the velocity dispersion measurements and the predicted values. In addition to the MST terms, the uncertainty in the model also includes the uncertainty in the anisotropy distribution aani. For lenses with multiple velocity dispersion measurements, the diagonal terms in the error covariance are illustrated (https://github.com/TDCOSMO/hierarchy_analysis_2020_public/blob/6c293af582c398a5c9de60a51cb0c44432a3c598/JointAnalysis/joint_inference.ipynb). (a) Fit to the time-delay distance. (b) Fit of velocity dispersion.
Current usage metrics show cumulative count of Article Views (full-text article views including HTML views, PDF and ePub downloads, according to the available data) and Abstracts Views on Vision4Press platform.
Data correspond to usage on the plateform after 2015. The current usage metrics is available 48-96 hours after online publication and is updated daily on week days.
Initial download of the metrics may take a while.