Fig. 9.
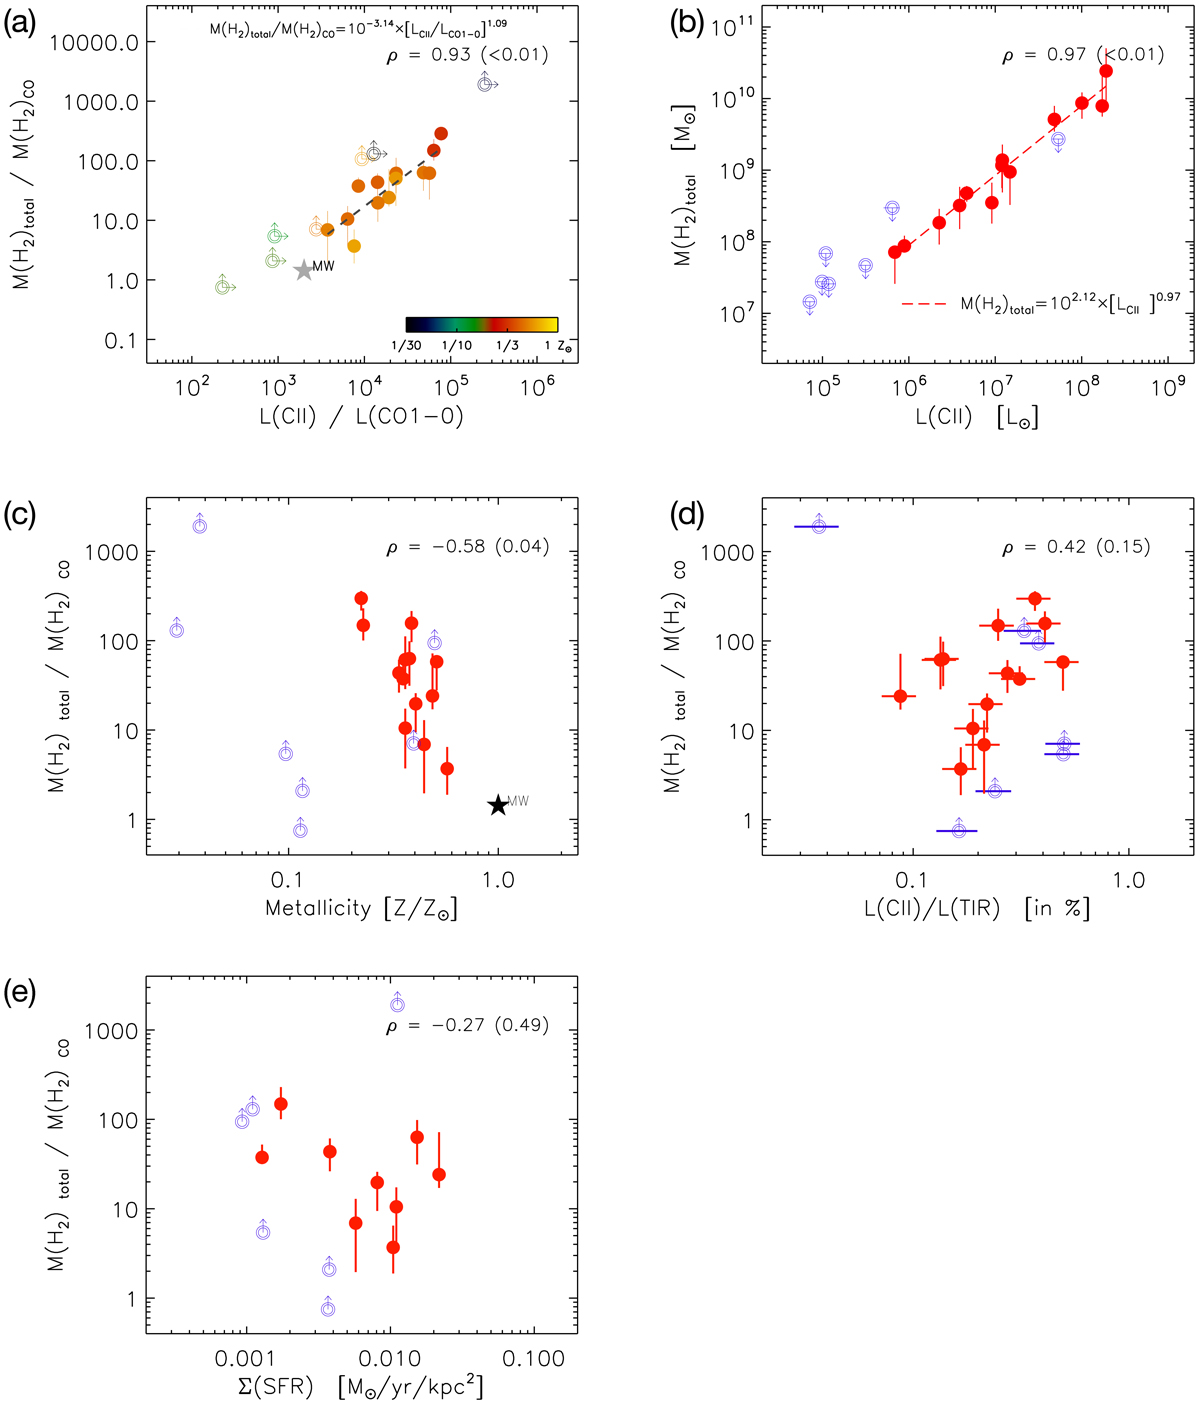
Results for the DGS sample and trends with observable parameters. The vertical axis of panels a, c, d, and e is M(H2)total/M(H2)CO (total MH2 determined from the model over the MH2 determined from CO observations and the Galactic conversion factor). The horizontal axes of these same panels are as follows: a: L[C II]/LCO(1−0) with colour code for Z. The correlation shown in the dashed line is described in the panel in the equation for M(H2)total/M(H2)CO as a function of the observed L[C II]/LCO(1−0); standard deviation is 0.25 dex. b: total MH2 determined from the models vs. the observed L[C II]. Our resulting relationship of MH2 as a function of L[C II] is given within the panel; standard deviation is 0.14 dex. c: M(H2)total/M(H2)CO vs. Z; d: M(H2)total/M(H2)CO vs. observed L[C II]/LTIR. e: M(H2)total/M(H2)CO vs. ΣSFR, where SFR is determined from total IR luminosity from Rémy-Ruyer et al. (2015). Spearman correlation coefficients (ρ) and p-values in parenthesis are indicated within each panel. Red points are DGS galaxies with CO detections. Open symbols in all panels are upper limits due to CO non-detections.
Current usage metrics show cumulative count of Article Views (full-text article views including HTML views, PDF and ePub downloads, according to the available data) and Abstracts Views on Vision4Press platform.
Data correspond to usage on the plateform after 2015. The current usage metrics is available 48-96 hours after online publication and is updated daily on week days.
Initial download of the metrics may take a while.