Fig. 4.
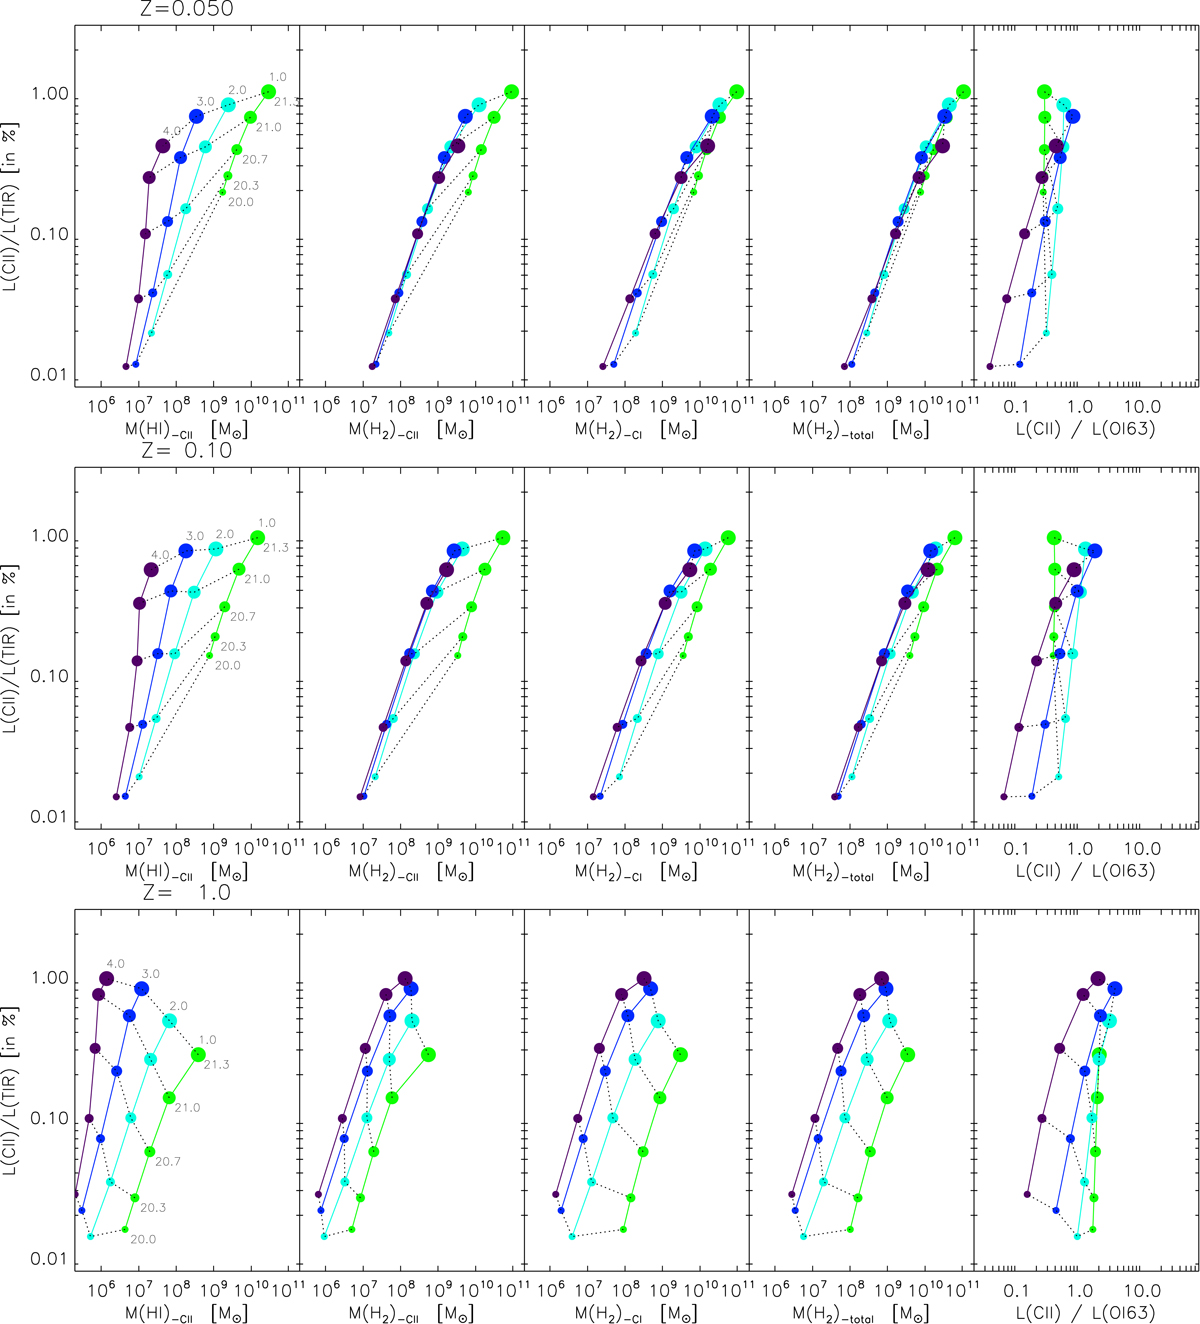
Grids of Cloudy calculations: model L[C II]/LTIR vs. H I and H2 mass reservoirs in the C+, C0-emitting regions, total H2 mass, and L[C II]/L[O I] behaviour (last column) in terms of metallicities of Z = 0.05, 0.1, and 1.0 Z⊙ (from top to bottom) and for a range of G0 and nH, the initial hydrogen density. The colour coding in each figure is log nH/cm−3 which increases from 1.0 (green) to 4.0 (purple). A range of G0 is set by varying log rin/cm from 21.3 at the top right of the grids (large dots) to 20.0 at the bottom left of the grids (smaller dots). These rin values cover a range of log G0 of 1.25 to 4.06 (Sect. 5). The Cloudy models are run with a source luminosity of 109 L⊙. Thus, the output masses should be scaled likewise (see Appendix A for details). The models are run to log N(CO)/cm−2 = 17.8 (AV ∼ 10 mag) for these grids.
Current usage metrics show cumulative count of Article Views (full-text article views including HTML views, PDF and ePub downloads, according to the available data) and Abstracts Views on Vision4Press platform.
Data correspond to usage on the plateform after 2015. The current usage metrics is available 48-96 hours after online publication and is updated daily on week days.
Initial download of the metrics may take a while.