Fig. 2.
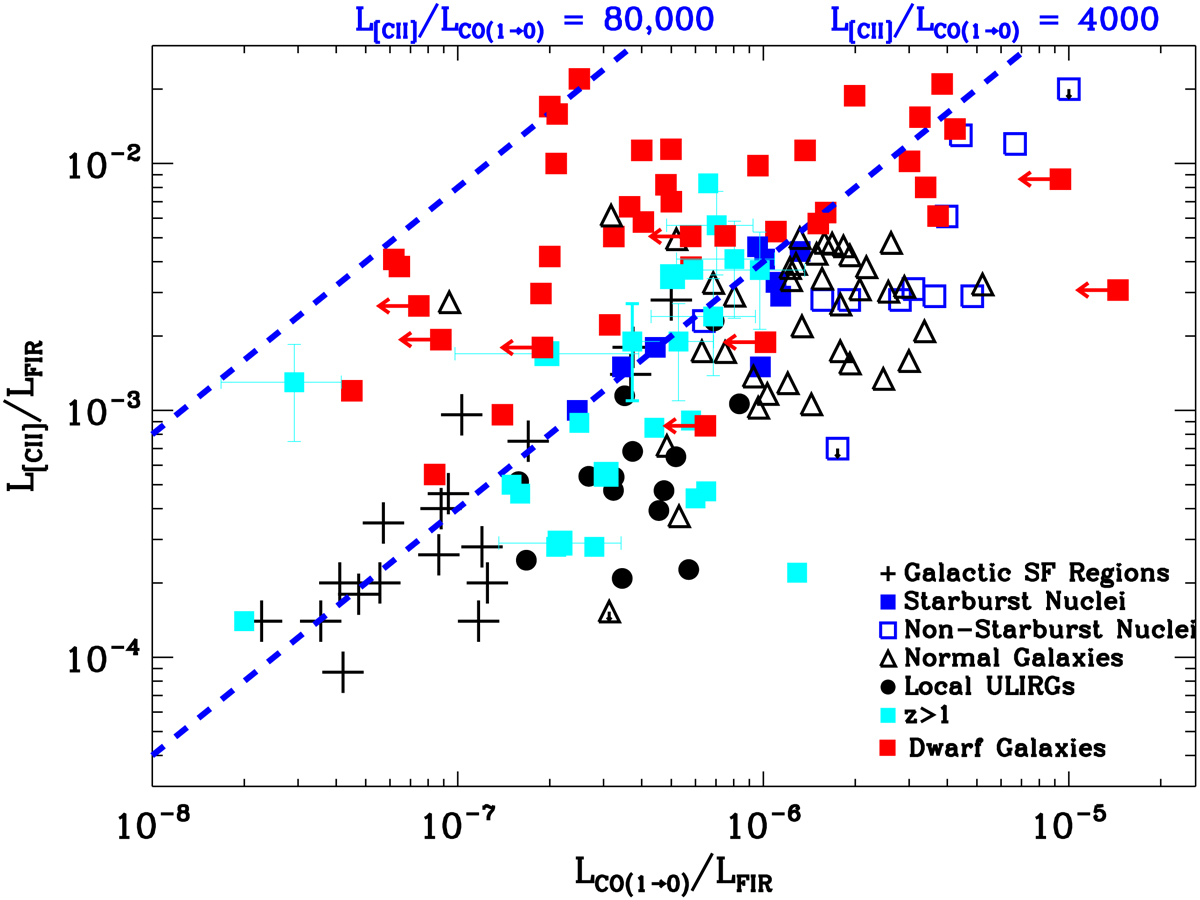
LCO(1−0)/LFIR vs. L[C II]/LFIR observed in galaxies varying considerably in type, metallicity, and star formation properties. This is updated from Stacey et al. (1991, 2010), Madden (2000), and Hailey-Dunsheath et al. (2010) to include dwarf galaxies and more high-redshift galaxies. The dwarf galaxies are from Cormier et al. (2010, 2015) for the DGS; Grossi et al. (2016) for HeVICs dwarfs, and Smith & Madden (1997). High-redshift galaxies include those from Hailey-Dunsheath et al. (2010), Stacey et al. (2010), and Gullberg et al. (2015). The black and blue symbols are data from the original figure of Stacey et al. (1991) for Galactic star-forming regions, starburst nuclei and non-starburst nuclei, ULIRGS (Luhman et al. 2003), and normal galaxies (Malhotra et al. 2001). The dashed lines are lines of constant L[C II]/LCO(1−0). We note the location of the low-metallicity dwarf galaxies (red squares) that show extreme observed L[C II]/LCO(1−0) values.
Current usage metrics show cumulative count of Article Views (full-text article views including HTML views, PDF and ePub downloads, according to the available data) and Abstracts Views on Vision4Press platform.
Data correspond to usage on the plateform after 2015. The current usage metrics is available 48-96 hours after online publication and is updated daily on week days.
Initial download of the metrics may take a while.