Fig. 10.
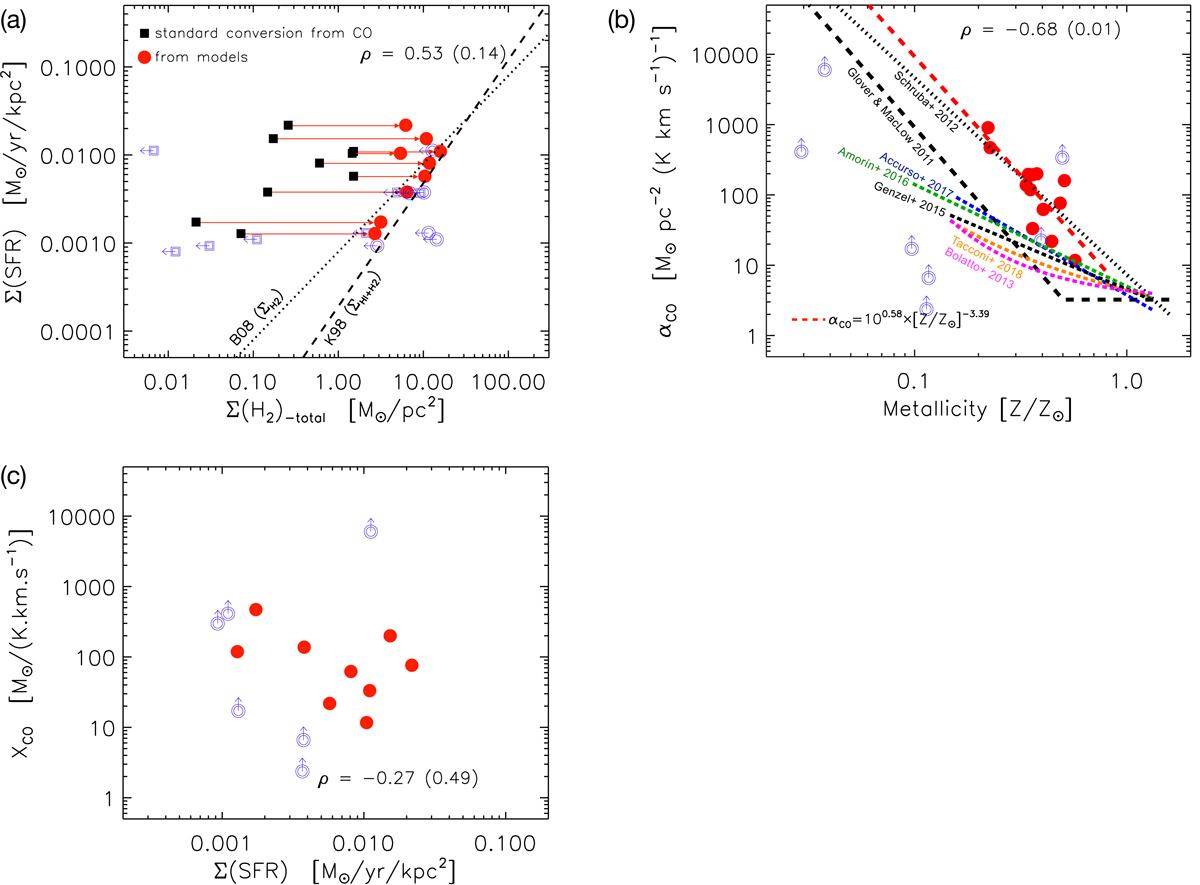
Consequences of quantifying the total H2 of the DGS sample. a: Schmidt–Kennicutt relationship and Bigiel et al. (2008) revisited. Solid black squares are the values when the MH2 is calculated from the CO-to-H2 standard conversion factor; solid red dots are the total H2 determined from our self-consistent models. The dashed line is the usual Schmidt–Kennicutt relation, where low-Z star-forming dwarf galaxies are normally outliers when CO is used to determine the H2 (Cormier et al. 2014). The dotted line is the Bigiel et al. (2008) relationship determined for the ΣSFR − Σgas relationship. b: αCO as a function of Z from Schruba et al. (2012; black dotted line), Glover & Mac Low (2011; long black dashed line), Accurso et al. (2017a; blue dashed line), Amorín et al. (2016; green dashed line), Genzel et al. (2015; short black dashed line), Tacconi et al. (2018; orange dashed line), Bolatto et al. (2013; pink dashed line), and our new αCO − Z relationship determined from this paper (red dashed line). Red solid dots are the total H2 determined from our self-consistent models in this paper. Also given in the panel is the derived expression to determine αCO as a function of Z from this new relationship, which has a standard deviation of 0.32 dex. c: XCO conversion factor from this paper and ΣSFR. Spearman correlation coefficients (ρ) and p-values in parenthesis are indicated within each panel. Red dots are DGS galaxies with CO detections. Open symbols in all panels are upper limits due to CO non-detections.
Current usage metrics show cumulative count of Article Views (full-text article views including HTML views, PDF and ePub downloads, according to the available data) and Abstracts Views on Vision4Press platform.
Data correspond to usage on the plateform after 2015. The current usage metrics is available 48-96 hours after online publication and is updated daily on week days.
Initial download of the metrics may take a while.