Fig. 3
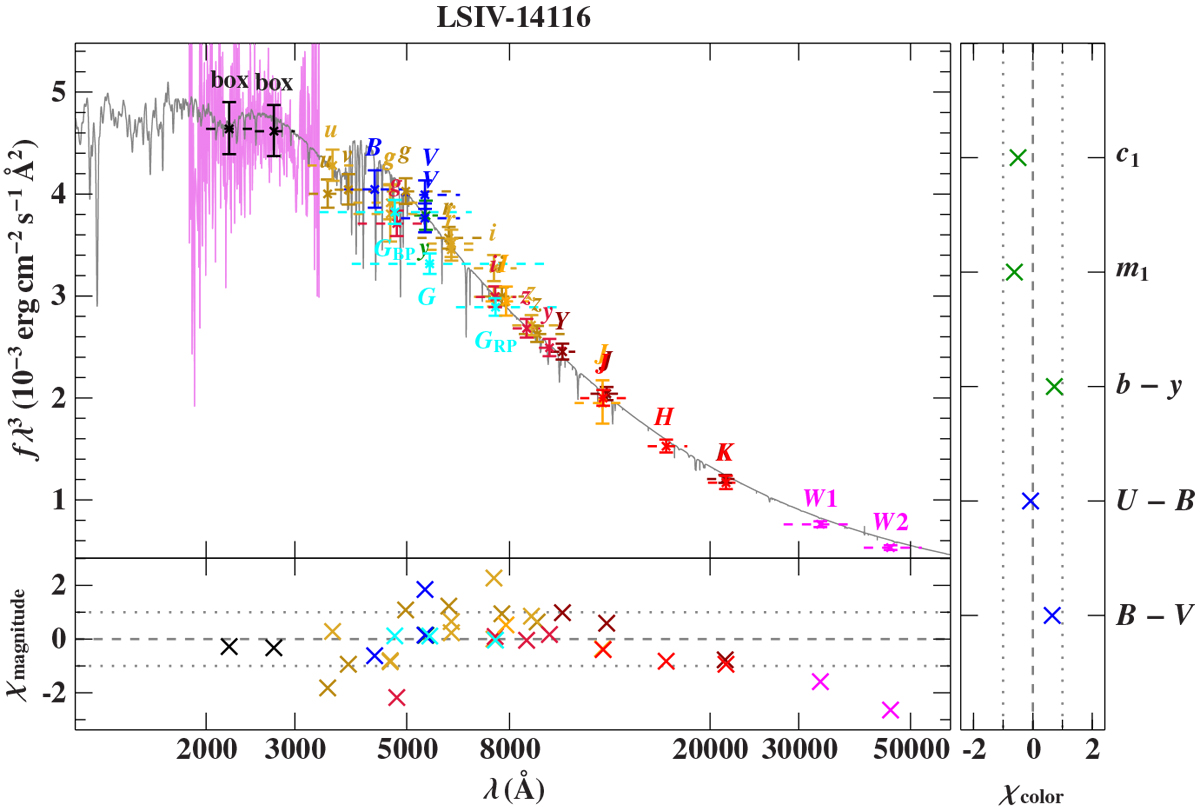
Comparison of smoothed final synthetic spectrum of LS IV–14°116 (grey line) with photometric data. The two black data points labelled “box” are binned fluxes from an IUE spectrum (LWP10814LL, magenta line, Wamsteker et al. 2000). Filter-averaged fluxes are shown as coloured data points that were converted from observed magnitudes (the dashed horizontal lines indicate filter widths). The residual panels at the bottom andon the right sides, respectively, show the differences between synthetic and observed magnitudes/colours. The following colour codes are used to identify the photometric systems: SDSS (yellow, Henden et al. 2015; Alam et al. 2015), SkyMapper (dark yellow, Wolf et al. 2018), Pan-STARRS1 (red, Chambers et al. 2016), Johnson-Cousins (blue, Henden et al. 2015; O’Donoghue et al. 2013), Strömgren (green, Hauck & Mermilliod 1998), Gaia (cyan, Gaia Collaboration 2018), VISTA (dark red, McMahon et al. 2013), DENIS (orange, DENIS Consortium 2005), 2MASS (bright red, Cutri et al. 2003), and WISE (magenta, Schlafly et al. 2019).
Current usage metrics show cumulative count of Article Views (full-text article views including HTML views, PDF and ePub downloads, according to the available data) and Abstracts Views on Vision4Press platform.
Data correspond to usage on the plateform after 2015. The current usage metrics is available 48-96 hours after online publication and is updated daily on week days.
Initial download of the metrics may take a while.